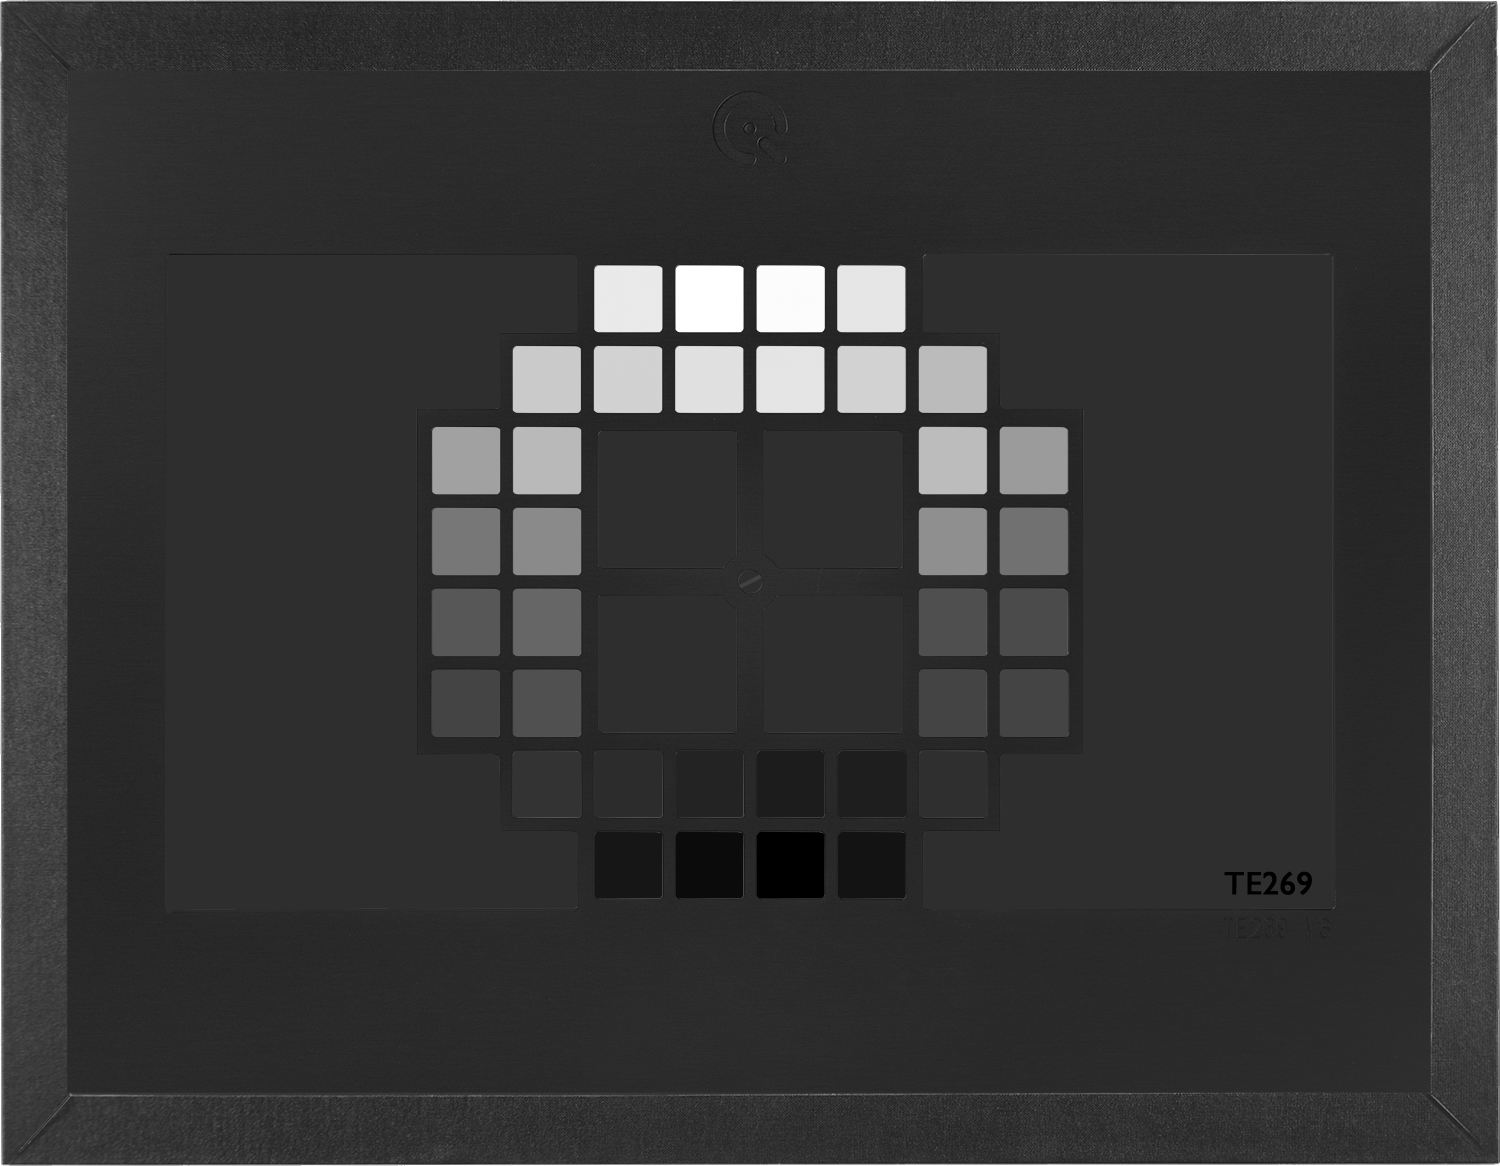
OECF 36 Chart (following ISO 14524/15739 and IEC 62676-5)
TE269 version 3 (V3) uses the same data measurements as version 2 but has a slightly different hardware design than V2 for increased stability. The original version of the TE269 uses two plates of glass built around the chart film. On occasion, we encountered a few problems with stray light and reflections from the glass. Version 3 replaces the glass with a metal frame, which greatly reduces the chance of stray light and reflections.
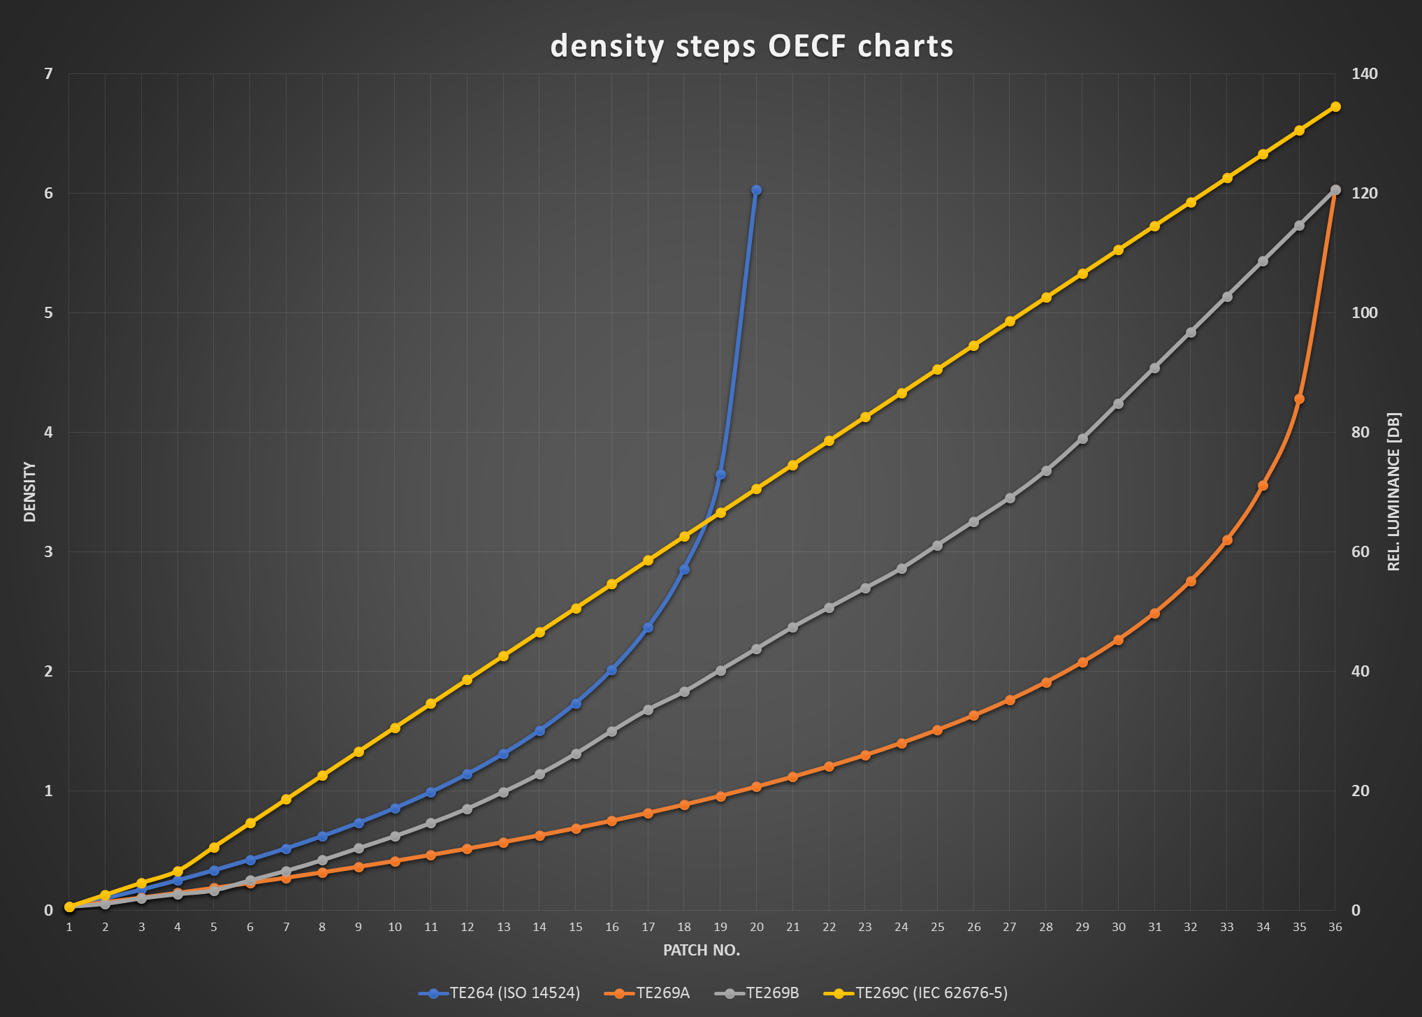
When working with high dynamic range cameras, it is normal to use OECF charts with patch densities according to ISO 14524. However, many of these charts have large gaps between the high-density patches because they are calculated using the cube root formula.
Our 36 patch OECF TE269B V3 chart presents a solution to this problem. While these charts still closely follow IS0 14524, it also implements additional steps to address the higher density levels. High dynamic ranges up to 1.000.000:1 / 120 dB are attainable using these charts. In addition, they also benefit from having a stable production process and being strongly neutral.
Transparent test charts are best illuminated using a uniform illumination device such as the high-powered LG3 light box.
The iQ-Analyzer-X software can be used for obtaining more accurate results of OECF, dynamic range, SNR, noise, temporal noise, and visual noise.
Technical information
- These transparent test charts are available in size D280
- The aspect ratio of the test pattern is 16:9 with integrated markers for 4:3 and 3:2 formats
- 36 patches with densities from 0.03 up to more than 6 (for 1.000.000:1 / 120 dB and higher)
- The standard version of TE269 V3 uses a screening to form the gray levels

The three variants available are:
TE269A V3
Gray patches according to ISO 14524.
TE269B V3
Better differentiation of the dark patches. The steps are based on the supporting points of the TE264 (20 patch chart) with a spreading of the steps in between.
TE269C V3*
This version has been adapted to the requirements of the standard IEC 62676-5: Video surveillance systems for use in security applications – Part 5: Data specifications and image quality performance for camera devices.
*For TE269C V3 we recommend using with a strong illumination device, e.g., LG3
The TE269 is supported by the iQ-Analyzer-X image evaluation software.
| Type | transparent |
| Format | D280 |
| Aspect ratio | 16:9 |
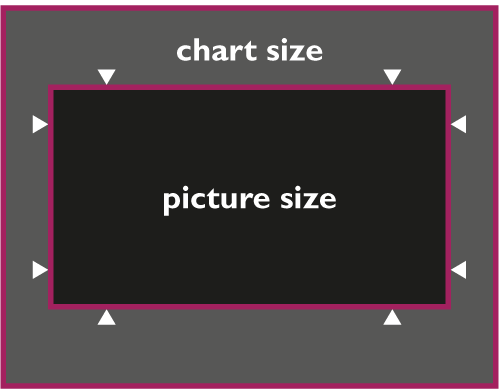
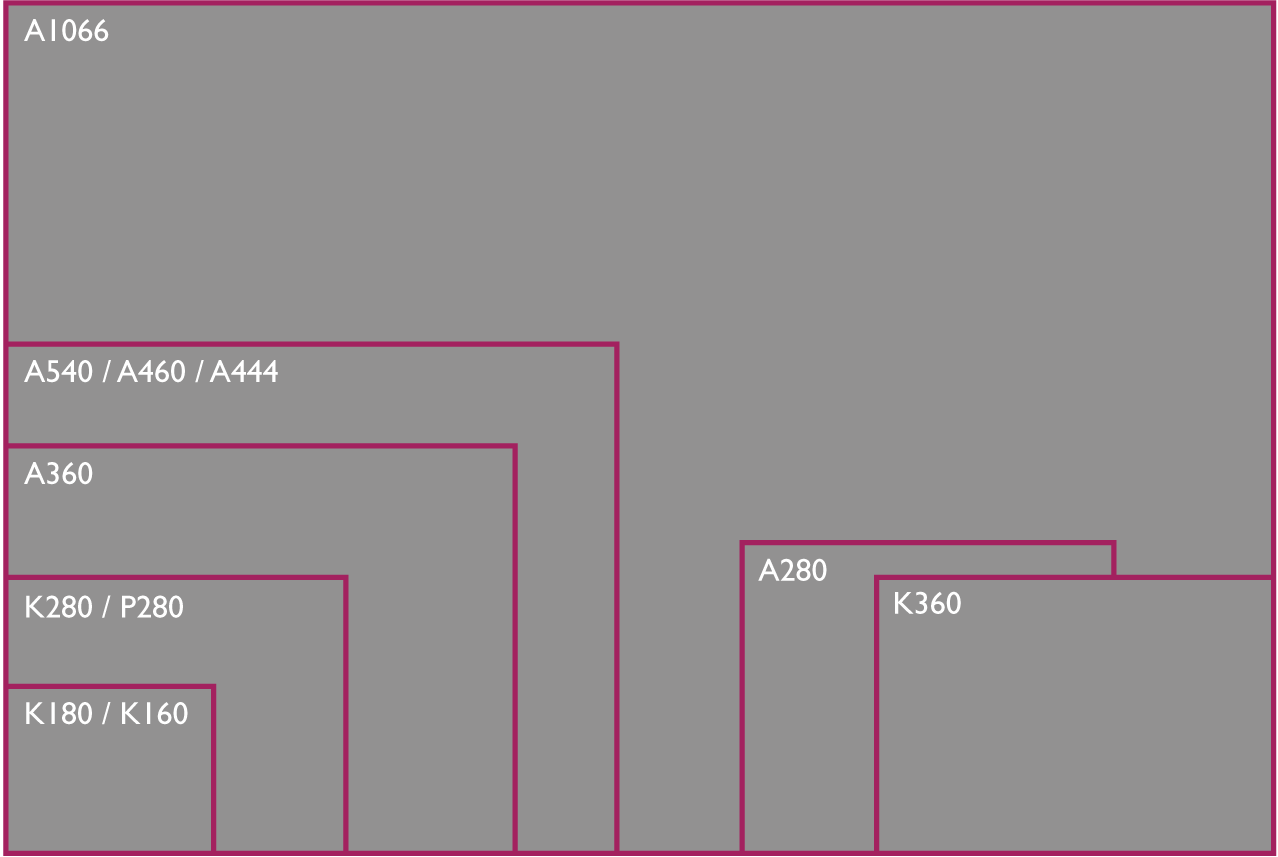
Chart sizes
The test charts are available in the sizes listed below. Please note that some charts cannot be manufactured in all sizes due to technical reasons. Please do not hesitate to ask for additional information.
During production, specific regions of test charts are measured to qualify the production process or to create individual reference data accompanying a test chart additionally. Measured regions can be color or gray tones.
The measurement devices are calibrated regularly and proven before use. You can find further information in our reference data accuracy sheet.

Reflective
| Picture size w x h [mm] | Chart size w x h x d [mm] (+/- 2 mm)* | ||
|---|---|---|---|
| 4:3 | 16:9 | ||
| A1066 | 800 x 600 | - | 1245 x 835 x 3.2 |
| A1066 (TE42*) | 900 x 675 | - | 1245 x 835 x 3.2 |
| A1066 | - | 1066 x 600 | 1400 x 835 x 3.2 |
| A1066 (TE42*) | - | 1200 x 675 | 1400 x 835 x 3.2 |
| A540 | 540 x 405 | 540 x 303.75 | 600 x 500 x 3.2 |
| A460 | 460 x 345 | 460 x 258.75 | 600 x 500 x 3.2 |
| A444 | - | 444.4 x 250 | 600 x 500 x 3.2 |
| A360 | 360 x 270 | 360 x 202.5 | 500 x 400 x 3.2 |
| K360 | - | 360 x 202.5 | 390 x 271 x 2.1 |
| A280 | 280 x 210 | 280 x 157.5 | 365 x 305 x 3.2 |
| K280 | 280 x 210 | 280 x 157.5 | 334 x 271 x 2.1 |
| P280 | May vary in size with the chart layout | 334 x 271 x 2.1 | |
| K180 | - | 180 x 101 | 204 x 164 x 2.1 |
| K160 | 160 x 120 | - | 204 x 164 x 2.1 |
A charts (size 280/360/460) are mounted on aluminium plates.
A charts (size 1066) are mounted on aluminum composite panels (aluminum dibond).
K charts mounted on black polystyrene plates are only available in combination with the test chart folders
P charts are mounted on black polystyrene plates.
*Sizes are for all variations of the TE42 chart series, including TE42 V2, TE42-LL, TE42-LL Timing

Transparent
| Picture size w x h [mm] | Chart size w x h x d [mm] (+/- 2 mm)* | ||
|---|---|---|---|
| 4:3 | 16:9 | ||
| D280 | 280 x 210 | 280 x 157.5 | 360 x 280 x 4.6 |
| D240 | 240 x 180 | 240 x 135 | 320 x 290 x 4.6 |
| D240S | 240 x 180 | 240 x 135 | 360 x 280 x 4.6 |
| D205 | 205 x 153 | 205 x 115.3 | 253 x 202 x 3.5 |
| D120 | 120 x 90 | 120 x 67.5 | 155 x 135 x 4.0 |
| D60 | 60 x 60 | - | 100 x 100 x 4.5 |
| D35 | 32 x 24 | - | 50 x 50 x 3-4 |
D60 charts are intended to be used with the Vega light source and are constructed with aluminum, PLA plates, and a magnet mount. .
D35 charts are either between glass plates or mounted in slide frames (glassless).
There are exceptions regarding mounting and size for special charts.

Suitable transparent charts for the following illuminators
| D280 / D240S | D240 | D205 | |
|---|---|---|---|
| Spherical transparency illuminator LE6/LE7 Lightbox illuminator LG3 Sony Pattern Box |
DNP standard viewer | Porta Pattern spherical transparency illuminator |
|
| With adapter | Spherical transparency illuminator LE6/LE7 Lightbox illuminator LG3 |
||
*Chart sizes may vary by +/- 2 mm as they are handmade in house.
