Multipurpose test charts
Improve your testing efficiency
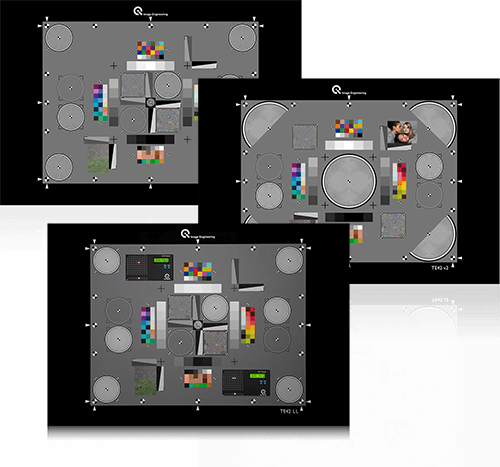
Some of our most popular products are our multipurpose test charts, especially our TE42 chart line. Each TE42 chart option uses the same grey background and a collection of test targets for measuring multiple image quality factors in a single image.
We currently offer the standard TE42 in its second version, the TE42-LL for advanced low-light testing scenarios, and the TE42-LL Timing chart that incorporates two LED-Panels into the TE42-LL chart for evaluating all of the essential timing parameters of a camera system.
Even though the LL in the two latter versions stands for low-light, both are still capable of all the vital image quality measurements, including those outside the low-light range. Both low-light versions of TE42 are used every day in our iQ-Lab and when we perform tests according to the VCX standard.
Each TE42 chart is available in 4:3 or 16:9 format. For the TE42-LL, we offer a combined 4:3 and 16:9 format. Contact our sales department for details.
Check out our latest blog post to learn more about our multipurpose test charts.
Flexible illumination for reflective targets
Using the iQ-Flatlights for test lab illumination
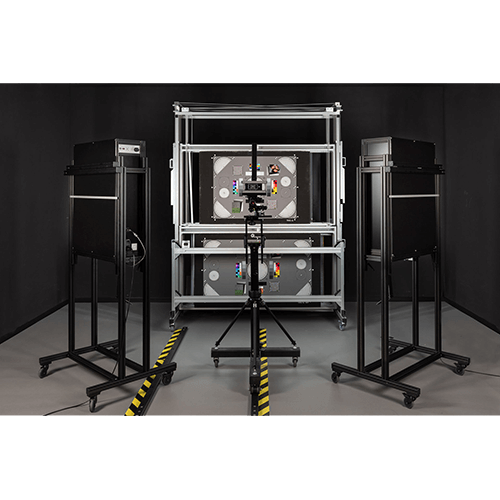
A typical test setup in our iQ-Lab includes a test target or a multipurpose test target and the iQ-Flatlights for flexible illumination. These lights are powered by iQ-LED technology, which allows you to generate custom spectra in a range of 380 – 820 nm. They are very effective in low-light testing scenarios and pair well with our TE42 multipurpose test charts.
We also offer a VIS-IR (visible infrared) version of the iQ-Flatlights that expands the spectral range to 380 – 1050 nm for near-infrared testing.
Image quality evaluation software
The iQ-Analyzer-X is a robust evaluation software
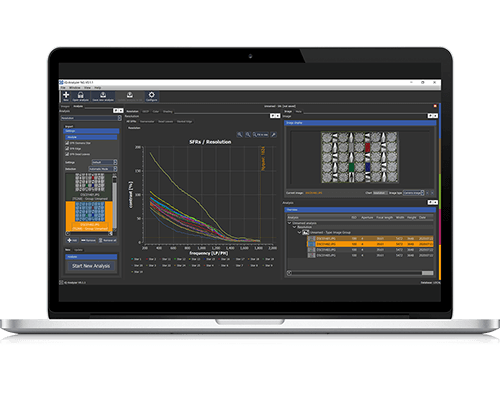
iQ-Analyzer-X is what we use to evaluate image quality performance. The software uses a flexible user interface and automatic chart detection to increase the effectiveness and speed of the analysis.
When using a TE42 multipurpose chart, the software can detect and evaluate each target for the system's performance. It can also analyze individual reference data, save the results and image files to a local database, and implement custom test templates.
The latest version, 1.8.0, supports VCX measurements in video and image files of chart TE295. This version also contains a separate tool for capturing images and videos from cameras of distant PCs (laptops) in a network via TCP/IP protocol.
QA-62 test chart
A new version of the QA-62 test chart
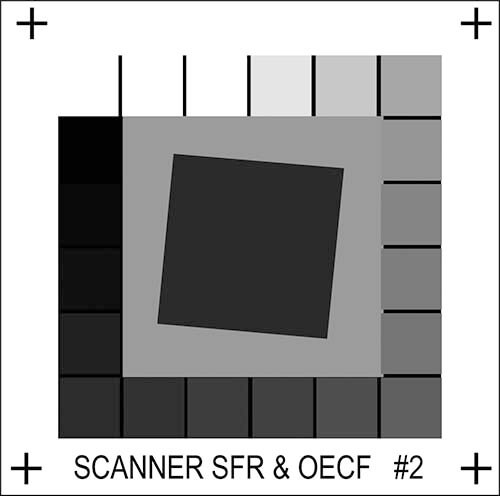
The QA-62 comprises twenty patches to determine the OECF for linearization and noise data. The chart evaluates a digital system's Spatial Frequency Responses (SFR) using the two horizontal and two vertical slanted edges.
We now offer this chart as a transparent version in size 35 x 60 mm (± 2.5 mm). This chart can be evaluated using the iQ-Analyzer-X.
Flexible illumination for transparent charts
Using the LE7 for test lab illumination
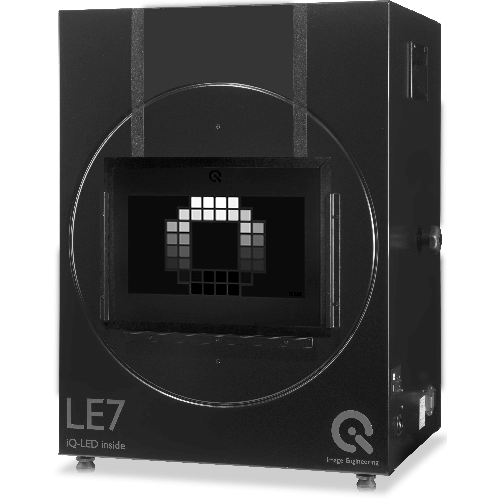
The LE7 lightbox uses iQ-LED technology to generate custom spectra in a 380 – 820 nm spectral range. We use the LE7 every day in our iQ-Lab to illuminate transparent test charts, e.g., OECF charts, uniformly.
We also offer a LE7 VIS-IR version, which expands the spectral range from 380 – 1050 nm for testing in near-infrared (NIR) situations. LE7-E is another version that can create a dynamic range up to 1:100,000. Such a wide dynamic range expands the testing possibilities, especially in low-light scenarios.
Carbon neutral production
Image Engineering is proud to be the first company in the Nynomic group to announce that its production in Germany is now carbon neutral. We implemented multiple changes and upgrades in our headquarters to achieve carbon neutrality.