
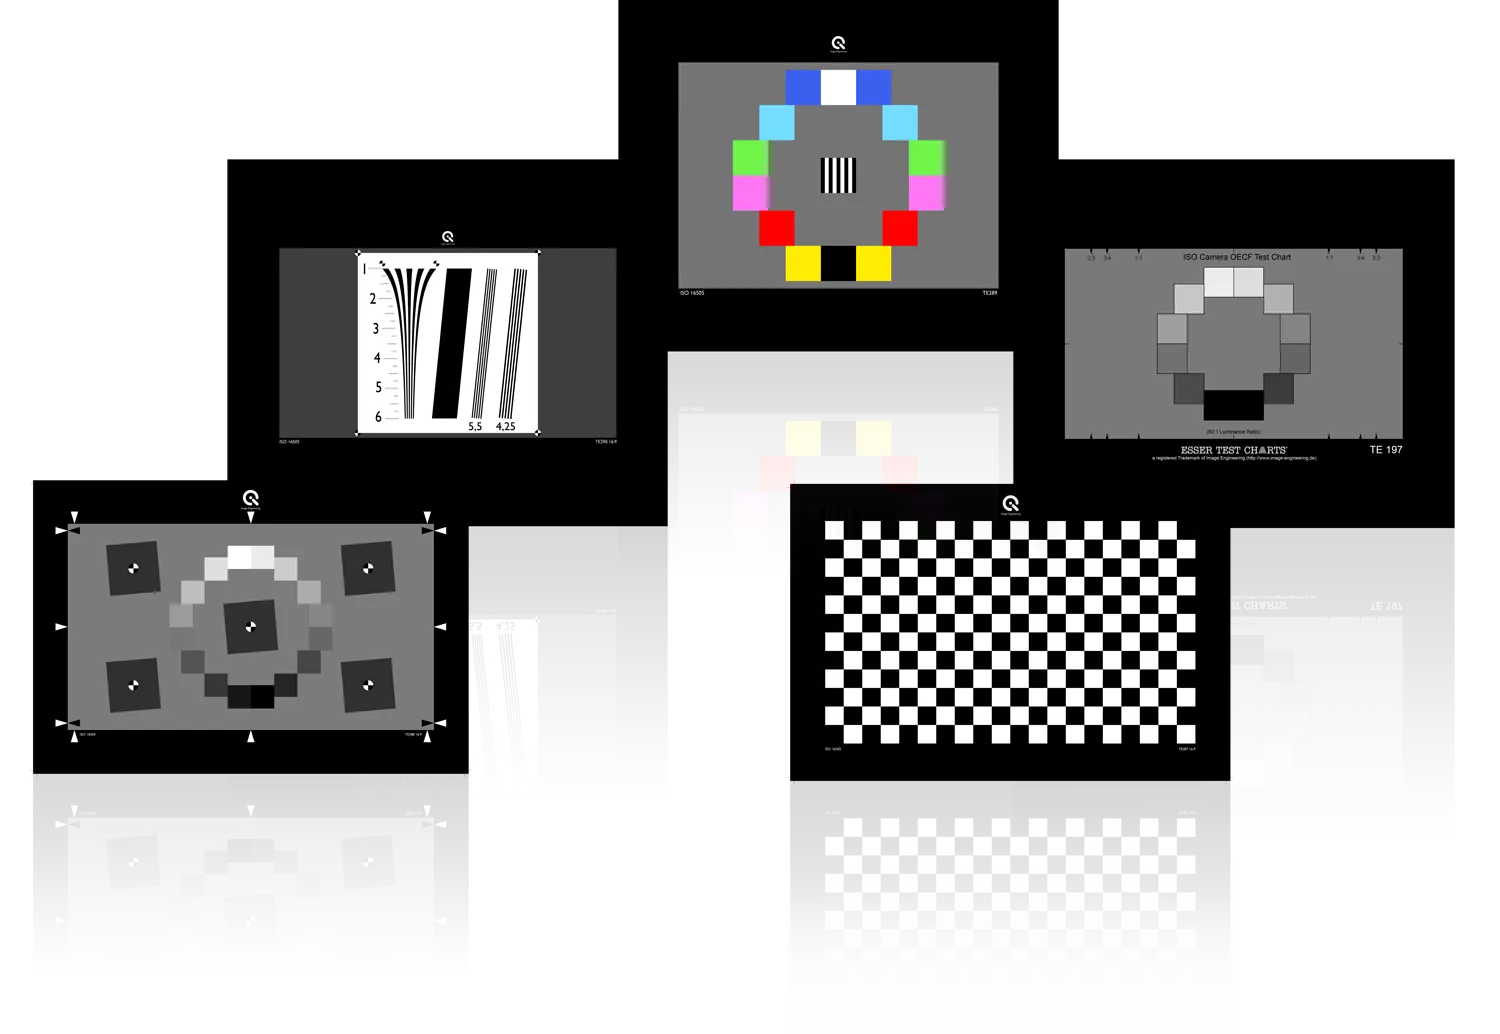
Comprehensive Test Charts for Diverse Image‑Quality & Industry Applications
Professional image‑quality testing starts with reliable, standards‑compliant test charts. Our portfolio covers more than 200 chart types designed for camera evaluation, low‑light testing, spectral analysis, resolution measurement, grayscale performance, color reproduction, and lens characterization.
Each chart is engineered for precision and optimized for use with modern analysis workflows, including iQ‑Analyzer‑X support.
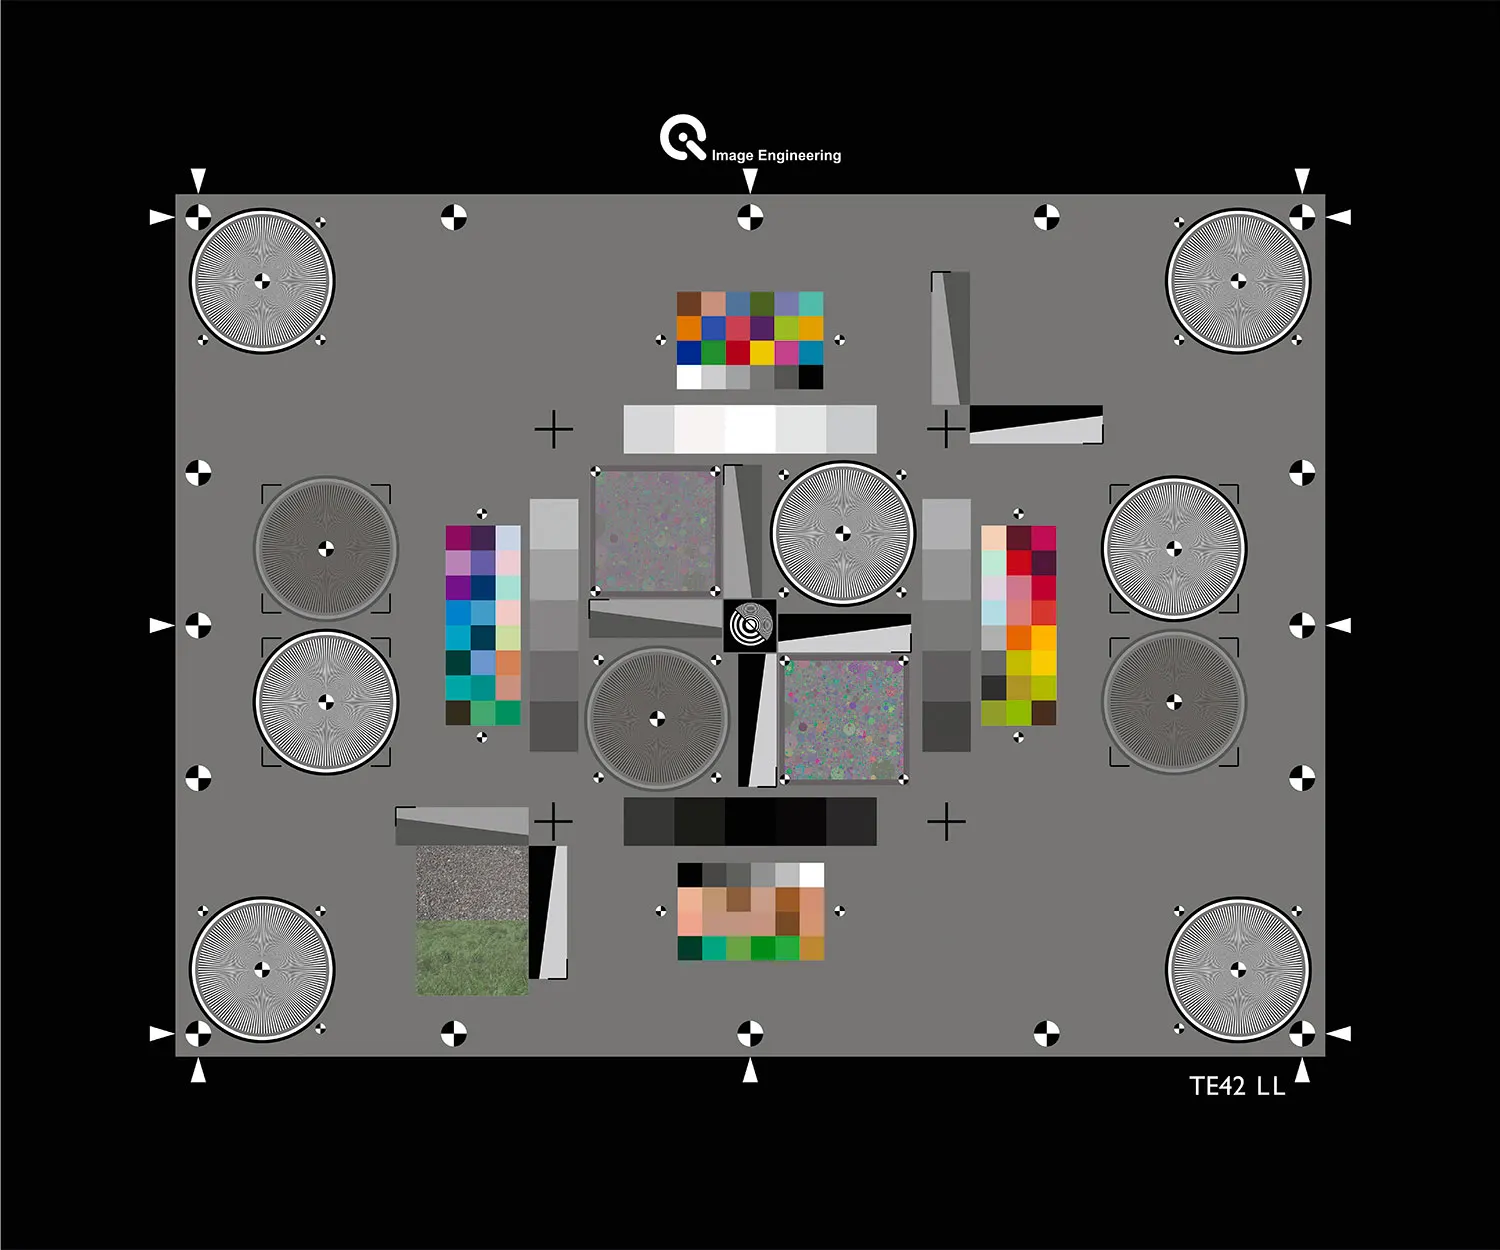
The TE42 chart is a multipurpose test chart that can quickly gather an overview of a camera's image quality performance in a single image.
Below you’ll find a selection of key chart families. Many additional charts and custom designs are available upon request.
The documents that provide support for charts can be found here.
Multipurpose Test Charts
TE42 Series
The TE42 family provides a complete image‑quality snapshot in a single frame. It includes structures for resolution, texture loss, sharpening, OECF, noise, color, distortion, shading, and visual analysis.
The TE42 chart is designed with multiple objects on the same chart plane for testing a wide variety of image quality factors.
Variants include TE42 V2, TE42‑LL for low‑light, TE42‑LL-Timing with two LED Panels, TE42‑LL‑UW for ultra‑wide lenses, and TE42‑LL‑2AR with dual aspect ratios.
Low‑Light Performance Testing
TE42-LL
Designed according to ISO 19093, TE42‑LL places all critical structures in the center to avoid corner falloff.
The TE42‑LL test chart is… used primarily for measuring the low‑light performance of digital cameras as described by ISO 19093.
Options include timing measurement (ISO 15781), ultra‑wide analysis, and dual‑aspect‑ratio configurations.
Archiving and Scanner Evaluation
UTT (TE262 / TE263)
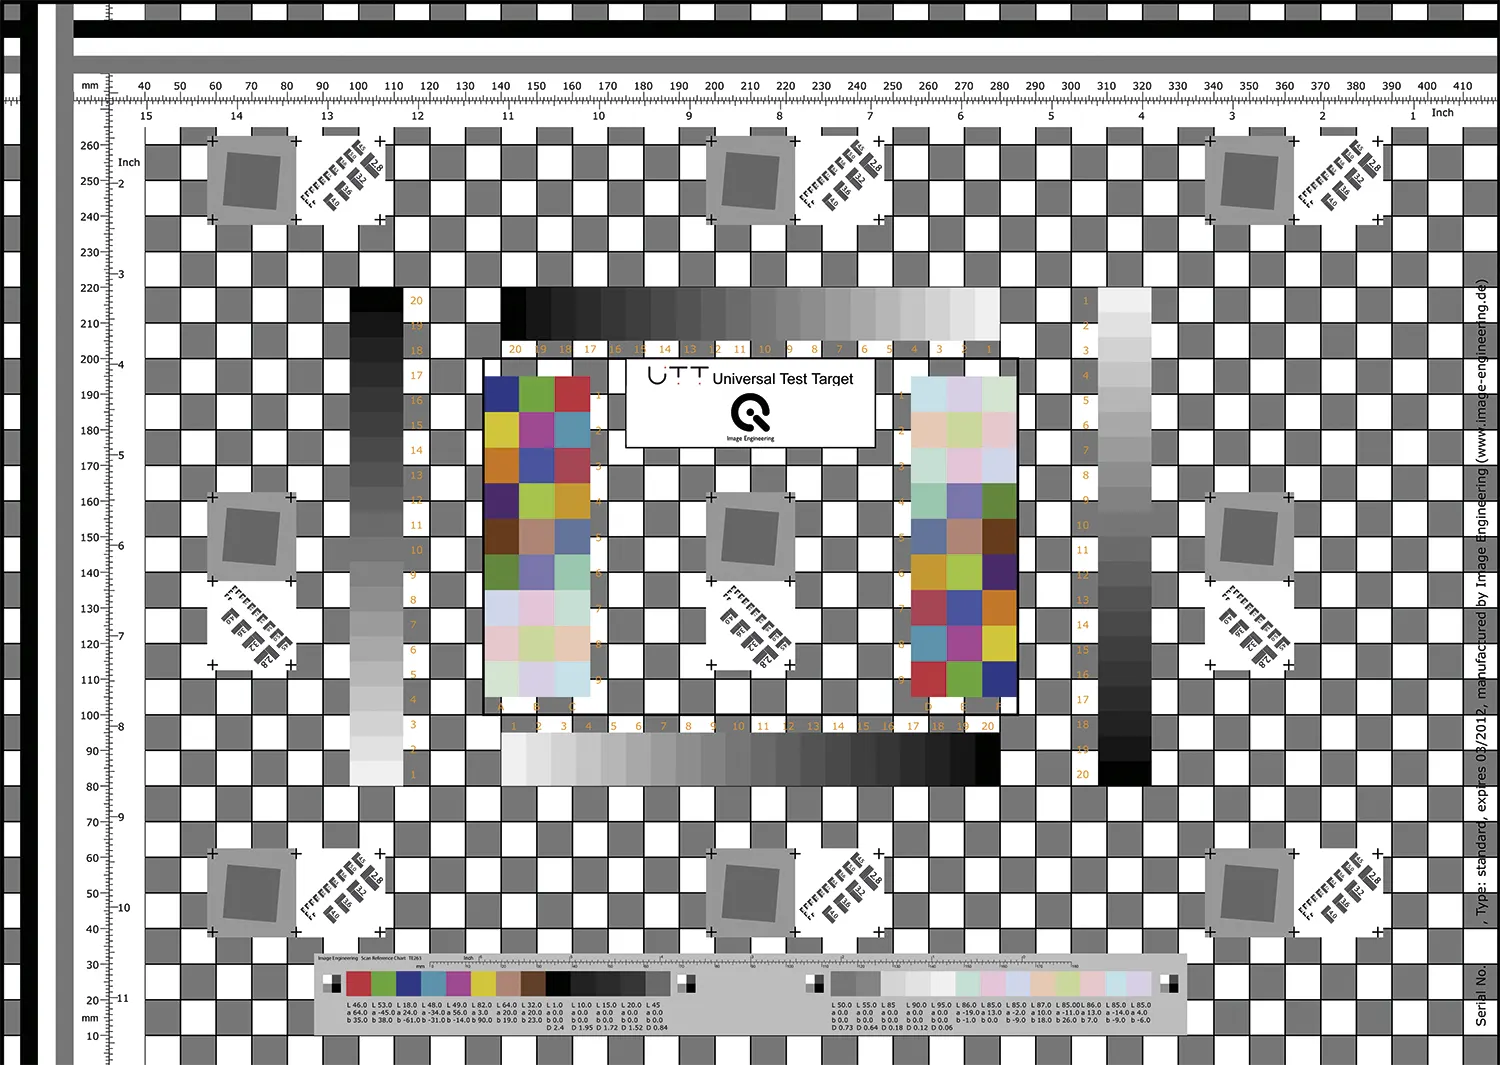
The Universal Test Target supports ISO 19264 workflows for scanners and archival imaging.
This chart can be used in accordance with ISO 19264, for analyzing image quality in the archiving industry.
It measures defect pixels, dynamic range, OECF, noise, color, resolution, shading, and distortion.
Spectral sensitivity & Camera Color Calibration
Skin‑Tone Charts for Natural Color Accuracy
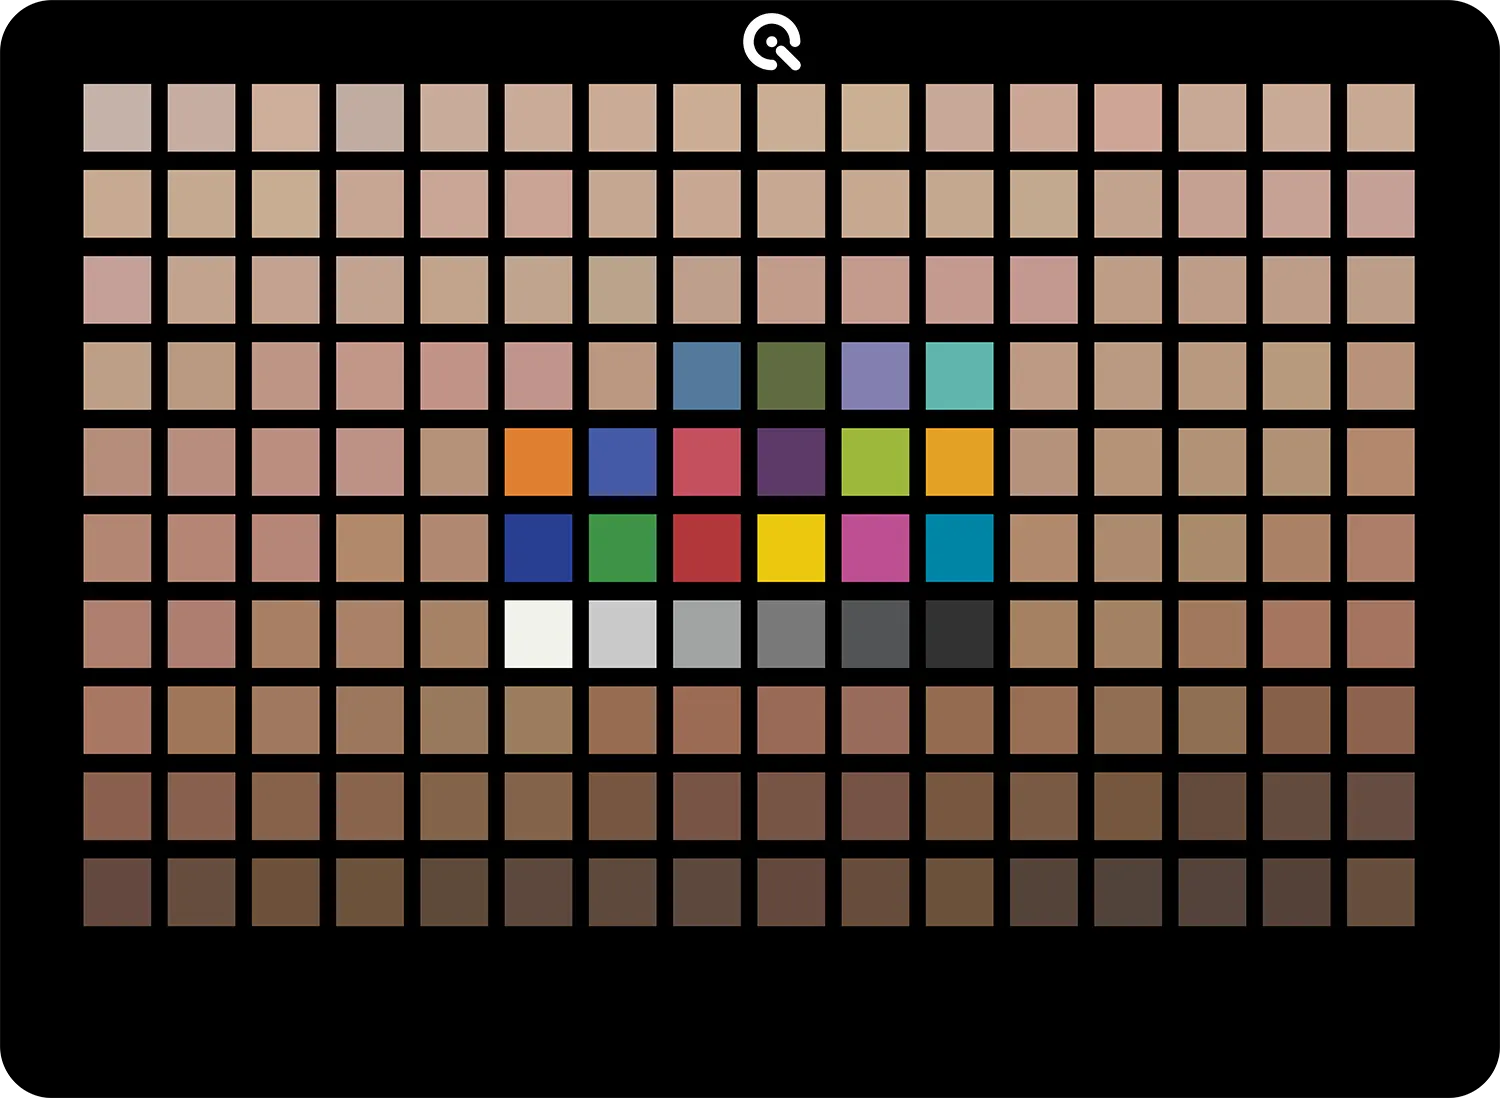
TE300
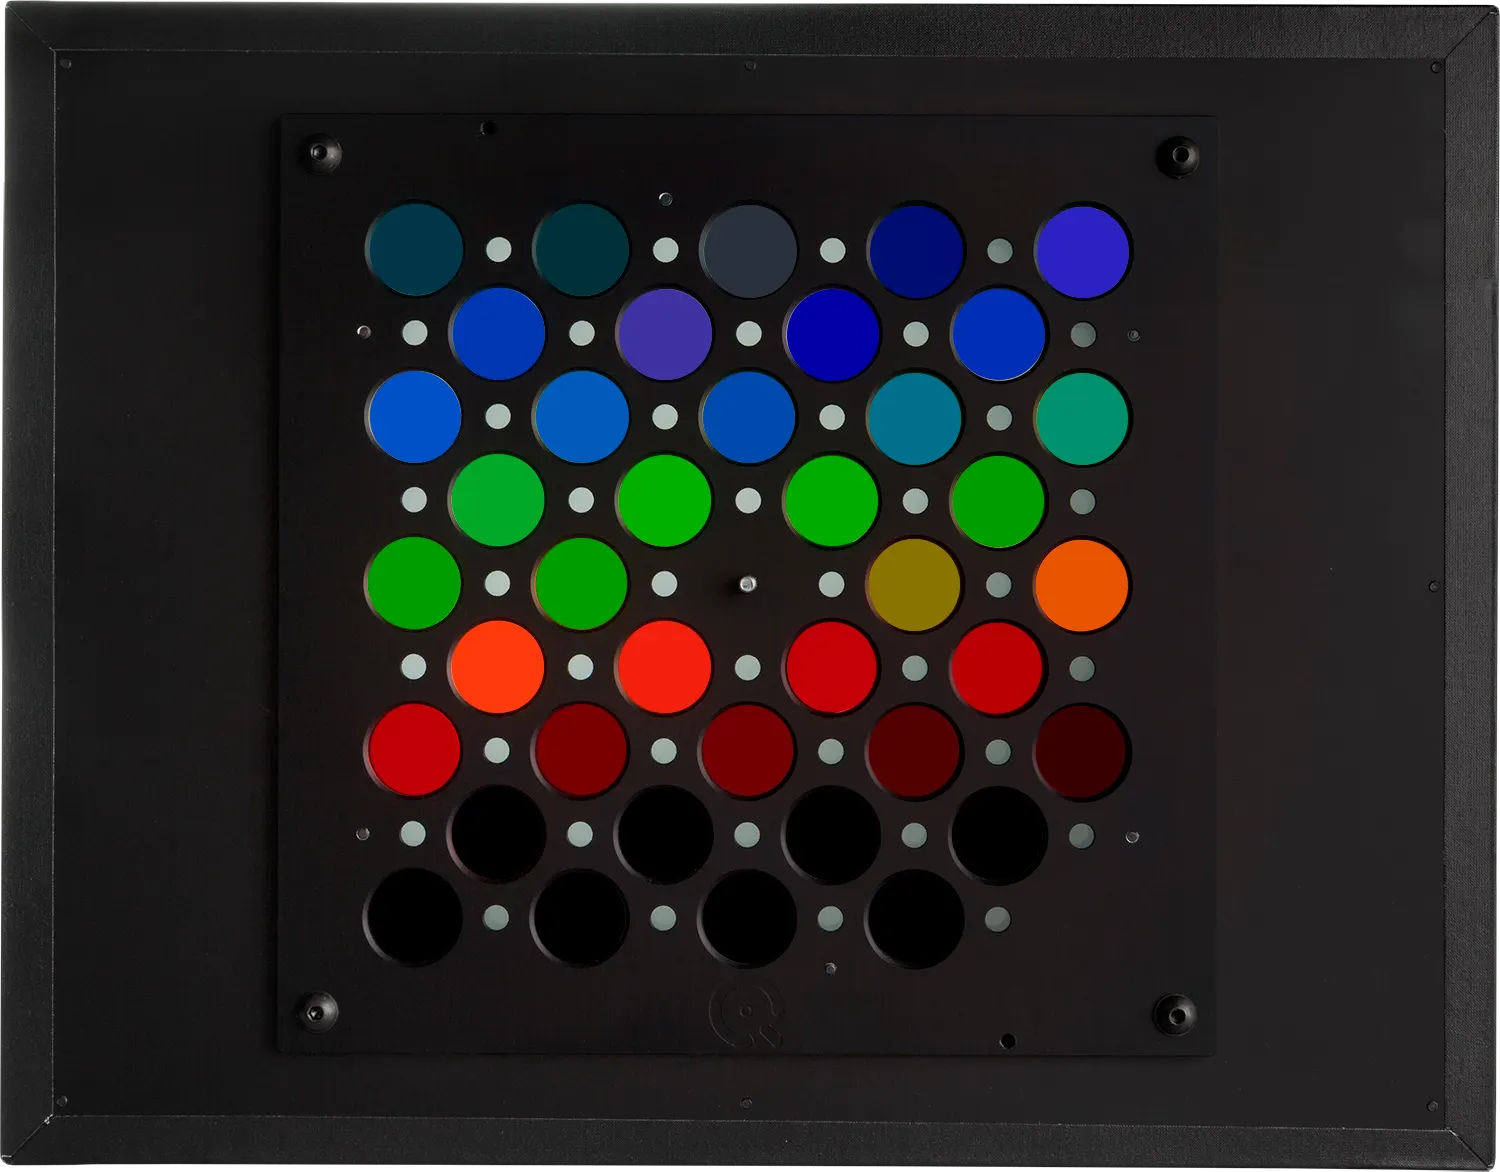
The TE300 Skin Tone Checker (Pantone SkinTone‑based) provides a realistic reference for evaluating a camera’s ability to reproduce diverse human skin tones. Based on spectrally measured real‑world skin tones, it captures the subtle variations that standard color charts cannot represent. This makes it a reliable tool for assessing hue accuracy, tonal consistency, and color rendering under different lighting conditions.
Skin tones are a complex interplay of pigments, blood circulation, light scattering under the skin, and highlights.
Tailored to your Testing Needs
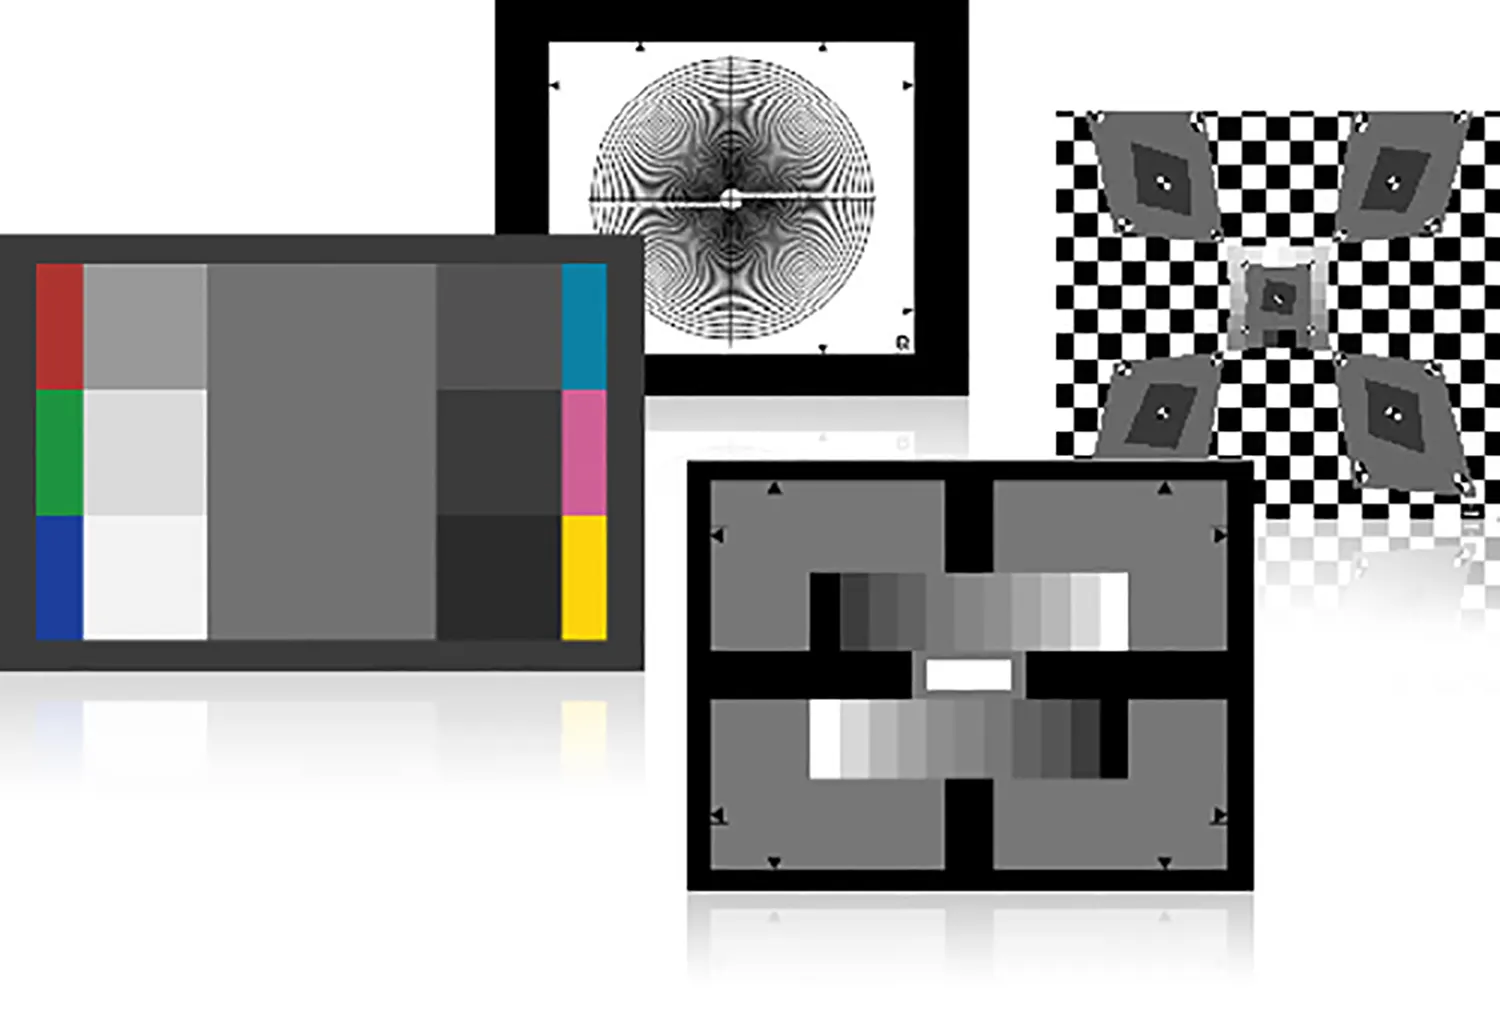
Custom Charts
If standard charts don’t match your requirements, custom layouts, materials, and patterns can be produced.
We also offer the option for test chart customization, allowing you to design your own chart layout.
High‑Precision Test Charts for Professional Camera Performance Analysis.
Comprehensive Test Charts for Diverse Image‑Quality & Industry Applications