Chromatic Aberration
Types, causes and measurement according to ISO 19084
Introduction
Lenses are designed so that light refracted at a lens meets at one focal point. Light, however, contains various wavelengths that refract differently. So light rays of different wavelengths may not meet at a common point. When this happens, color fringes appear along the borders of very light or very dark parts of an image affecting the image quality.
At a glance
Cause: different wavelengths are refracted differently by the lens (dispersion).
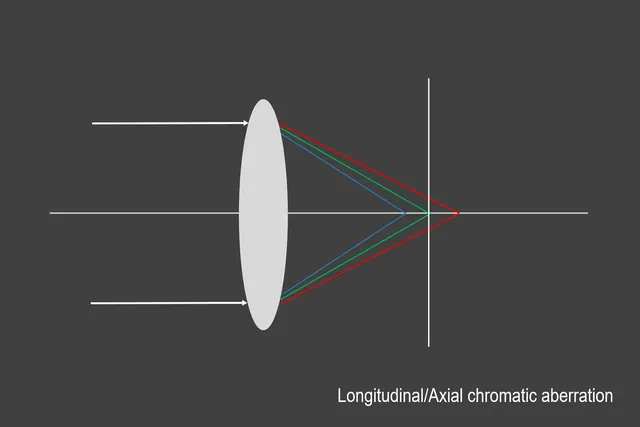
Longitudinal (axial): colors focus at different distances along the optical axis. Visible across the whole image, reduced by stopping down.
Lateral (transverse): colors are imaged at different positions on the sensor. Increases towards the corners, not reduced by stopping down.
Measurement: ISO 19084 describes how to measure chromatic displacement in the output image of digital cameras.
Key Products & Solutions
The background of chromatic aberration
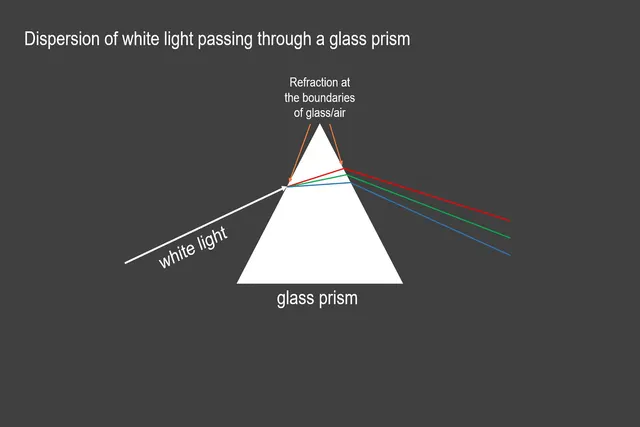
Chromatic aberration is caused by the dispersion of light best demonstrated by using a prism (in our case, a lens). Dispersion is the separation of visible light into its different wavelengths. The light that passes from one material to another will be refracted or bent at the boundaries.
Image 1: depicts the blue ray of light refracting stronger than that of the green and red. The refraction intensity depends on the wavelength and the optical density of the prism through which the light passes. Shorter wavelengths (blue) will bend more than longer wavelengths (red), and material with a higher optical density will bend more than a lower optical density. An index of refraction describes optical densities.
A few examples of optical densities:
Vacuum – 1.000
Air – 1.0003
Water – 1.3333
Crown Glass – 1.52
Dense Flint Glass – 1.66
Diamond – 2.417
Light passing through a lens is no different than light passing through any of the materials listed above. The focal length of a lens is dependent on the refractive index as different wavelengths will be focused on different positions as they pass through the lens into the sensor.
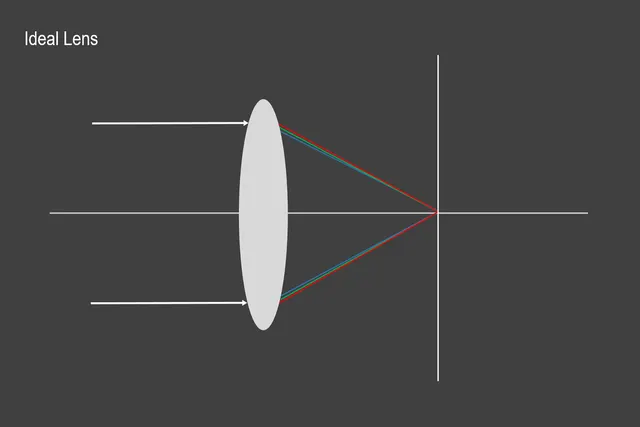
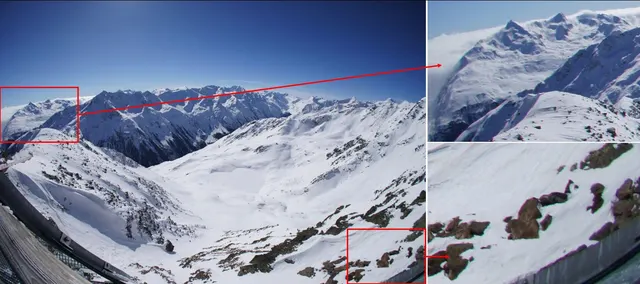
Ideally, a lens would offset the wavelengths' various dispersions by focusing them on the same point. This lens, however, does not technically exist as a single lens, and as a result, lens dispersion causes chromatic aberration. In other words, multiple colors of light will travel at different speeds while passing through a lens. This dispersion often leads to images with colored edges (red, yellow, green, blue, magenta, etc.), especially around objects in high contrast situations.
To compensate for the dispersion, optical systems consist of multiple convex and concave lenses and are made from different glass types with varying dispersion levels. Lenses that correct dispersion for two wavelengths are called achromatic lenses. Lenses with three corrected wavelengths are called apochromatic lenses.
Types of chromatic aberration
There are mainly two different chromatic aberration types, longitudinal (axial) and lateral (transverse).
Longitudinal (axial) chromatic aberration
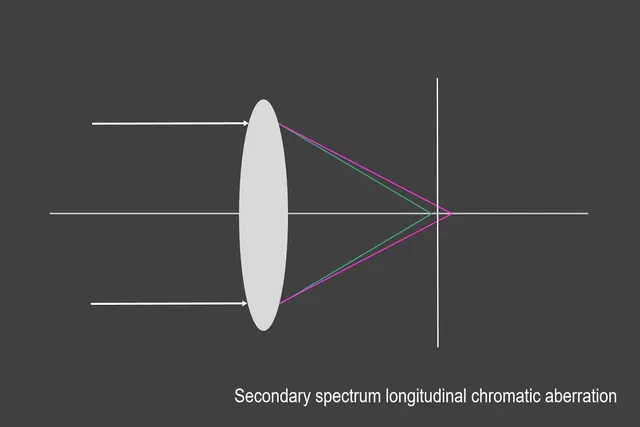
Longitudinal chromatic aberration occurs when different wavelengths disperse from the lens at various points along the horizontal optical axis (image 3). Wavelengths scattered across the axis are known as the circle of confusion, leading to unintentional color fringes even in the center of the image. One of the main strategies for reducing longitudinal chromatic aberration is stopping down the aperture as the aperture is responsible for the incoming light quantity.
Lateral (transverse) chromatic aberration
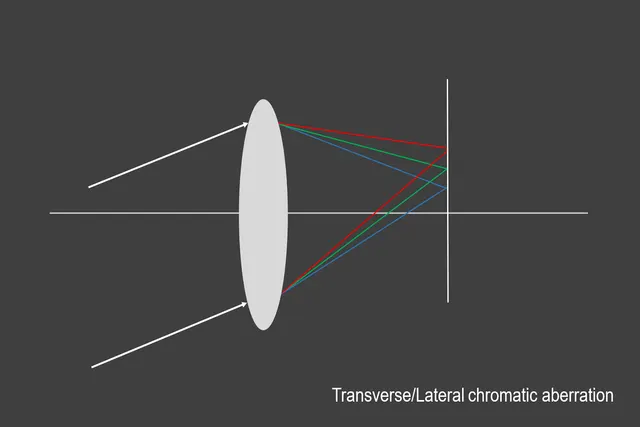
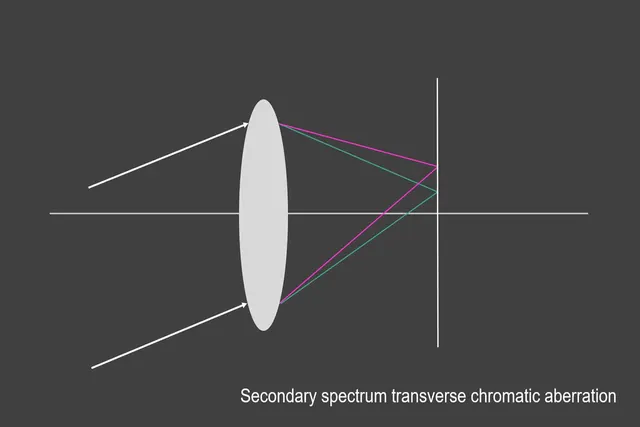
Lateral chromatic aberration occurs when different wavelengths enter the lens at an angle and then focus at various positions along the same focal plane. Compared to longitudinal chromatic aberration, lateral only develops towards the corners and gets visible at high contrast image structures. It cannot be fixed by stopping down the aperture. Lateral chromatic aberration can only be amended in post-processing software.
How to measure chromatic aberration?
In a digital camera, chromatic aberration becomes visible as a shift between the color channels. ISO 19084 describes how to measure this chromatic displacement directly from the camera’s output image, without removing the lens.
Schematic illustration
What is measured
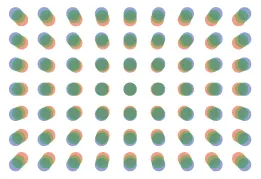
ISO 19084 defines chromatic displacement as the shift in location of features of different colors in the output image. The red and blue channels are compared with the green channel. The radial part of this shift is caused by lateral chromatic aberration.
Test chart and setup
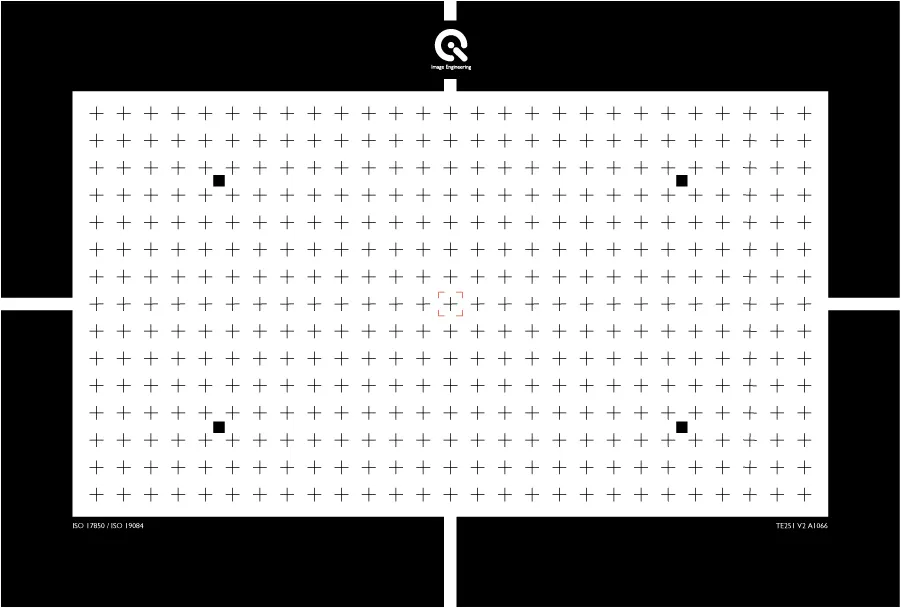
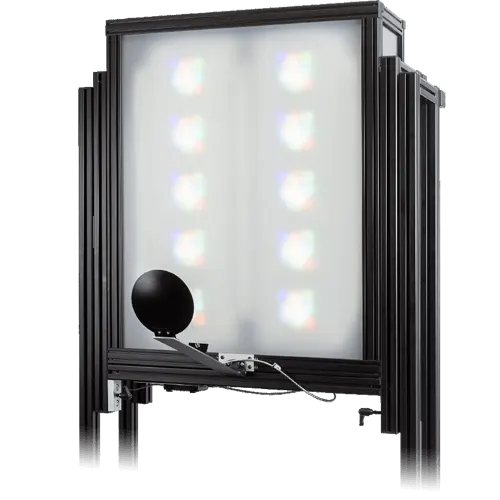
Test chart: The test charts consist of black crosses or dots arranged in a regular grid on a white background that fills the entire image field. For our measurements, we use the Image Engineering TE251 or TE260 test charts. These meet the requirements and can also be used to analyze geometric distortions.
Alternative: a V-pattern chart as described in the standard.
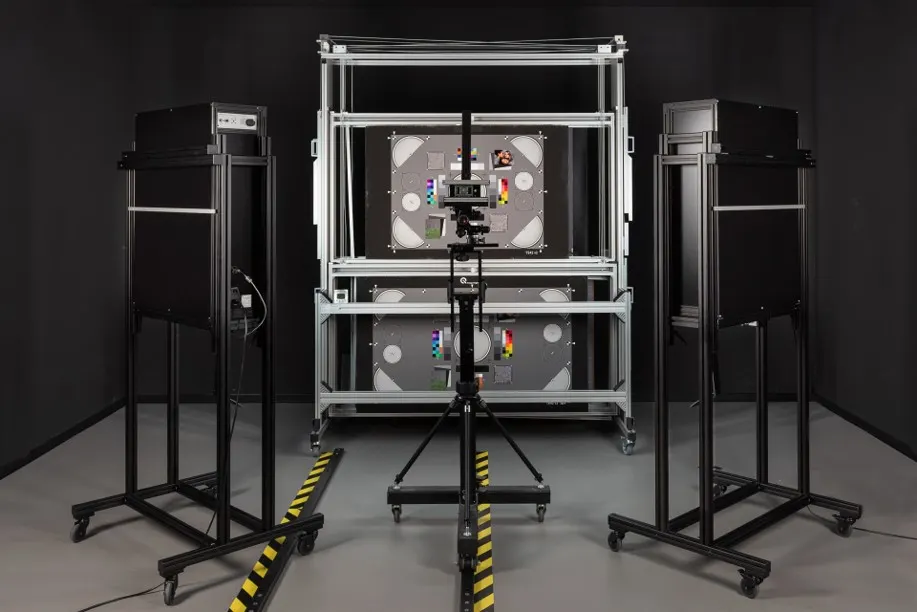
Setup: uniform illumination, chart parallel to the sensor, focus on the chart plane.
Efficient: the same capture can be used for geometric distortion according to ISO 17850.
Evaluation and results
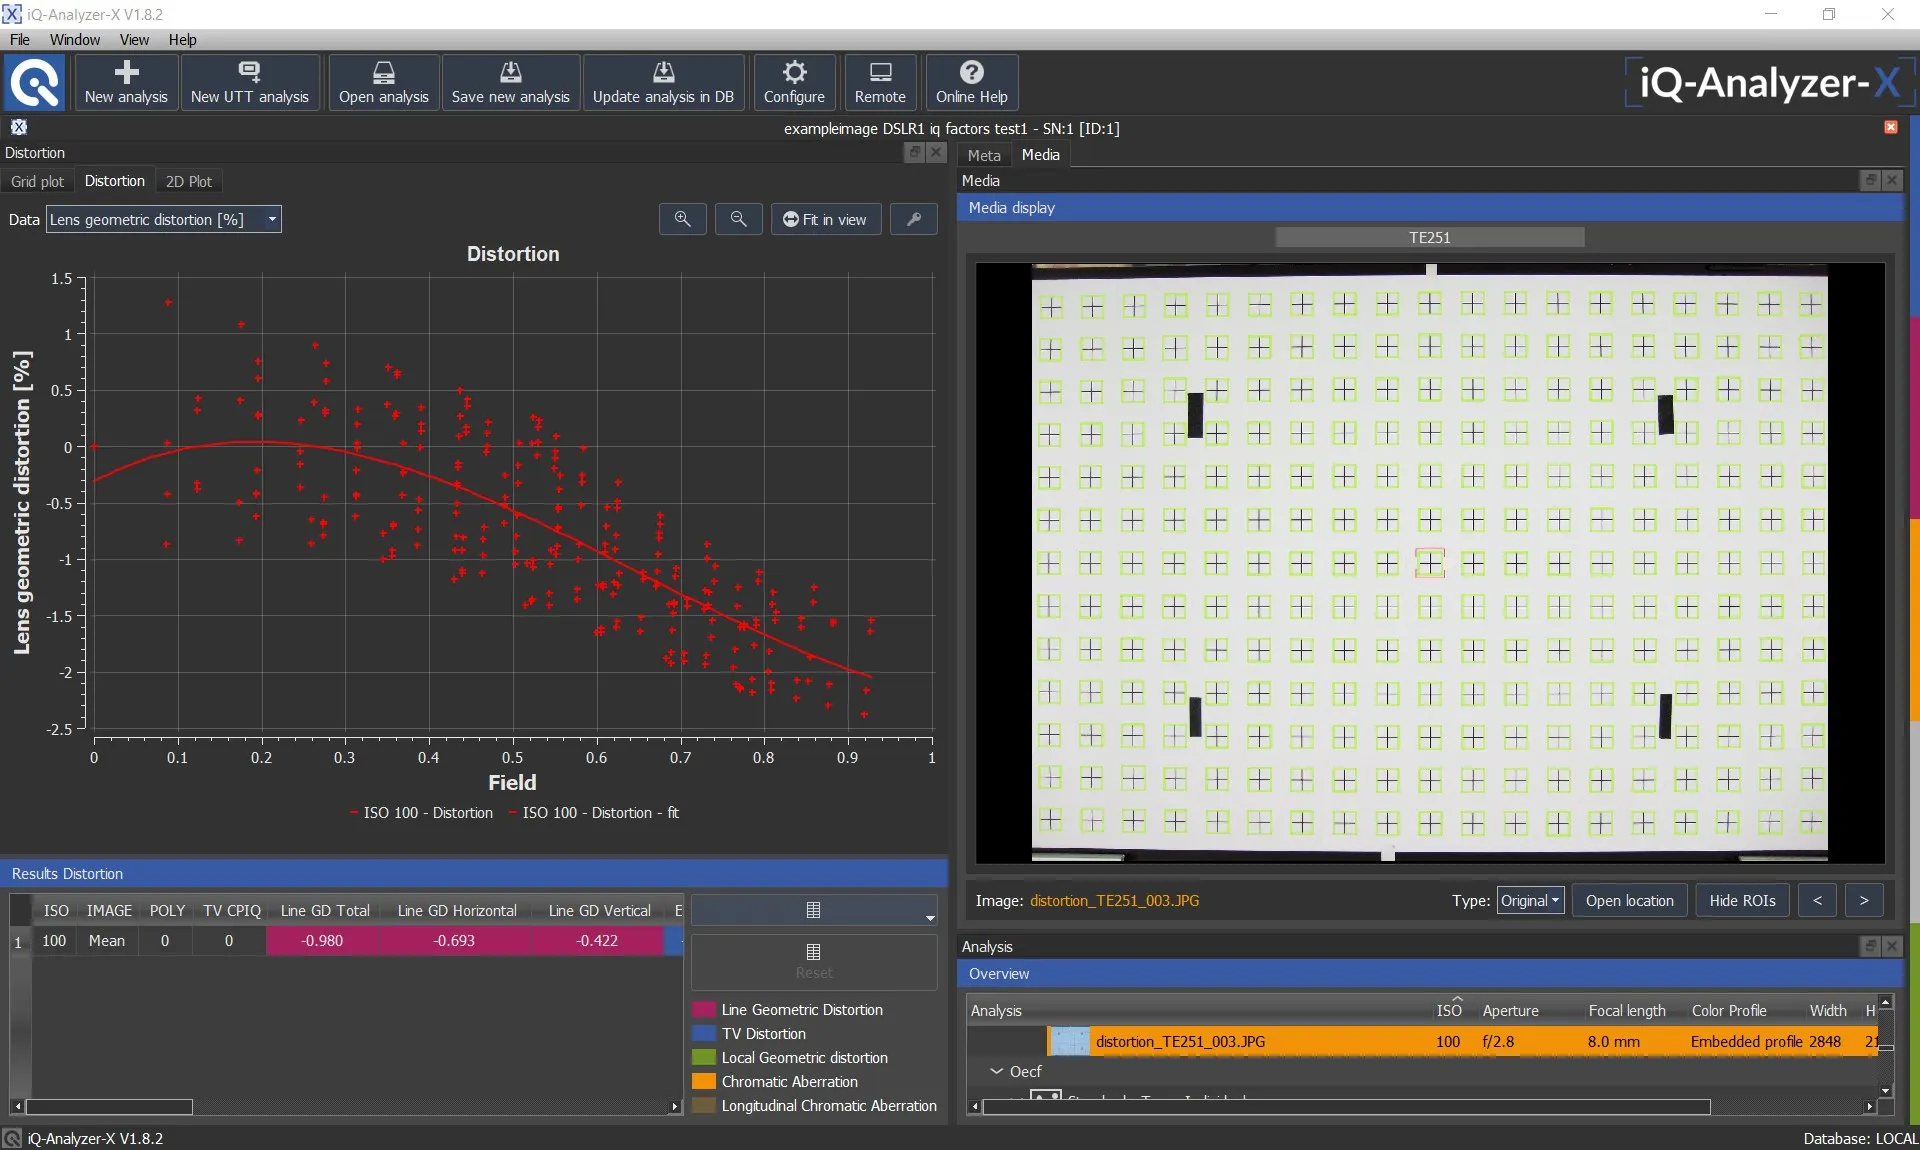
The center of each dot is determined separately in the red, green and blue channel.
The displacement of red and blue relative to green is calculated in pixels for every dot.
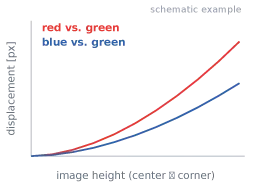
Results are shown over image height, the maximum is reported for comparisons, e.g. across zoom positions or apertures.
Lateral vs. longitudinal in practice
The displacement measurement captures lateral chromatic aberration from a single image. Longitudinal chromatic aberration causes color blur rather than a shift and requires other approaches, for example through-focus measurements.
Correcting chromatic aberration
Even though chromatic aberration is difficult to correct and often impossible to eliminate entirely, many lens solutions can lead to higher quality corrections … achromatic lens, apochromatic lens, primary and secondary spectrum.
Conclusion
The dispersion of light causes chromatic aberration … Chromatic aberration is often impossible to fully eradicate from a lens, but it is possible to keep it at a minimum. To keep it low, we recommend testing various lens solutions, such as achromatic or apochromatic designs, and measuring the chromatic displacement of the complete camera system according to ISO 19084.
Frequently asked questions
Related image quality factors
Further readings
About this article:
Written by the Image Engineering R & D team. Technical review: Uwe, Artman. Last updated: 2026 . Image Engineering is an independent test lab for camera image quality and the developer and manufacturer of the complete test infrastructure, including test charts, analysis software, and measurement equipment.