TE42 test chart series
Multipurpose charts for all your testing requirements
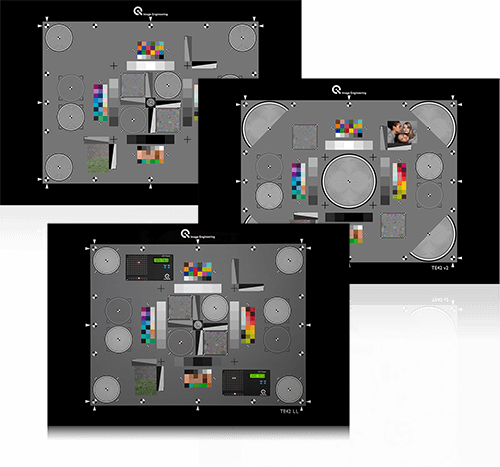
The TE42 chart series includes a variety of multipurpose charts for testing the overall image quality performance of a camera system. With the original TE42 chart, you can evaluate image quality factors, including resolution, texture loss, distortion, dynamic range, color, shading, noise, and chromatic aberration, all in one image.
Another chart in the series is TE42-LL. This version is optimized for low-light testing based on ISO 19093. TE42-LL-Timing is another chart that incorporates two LED-Panels into the low-light version of the chart to create an accurate low-light scene with timing measurement capabilities.
iQ-Analyzer-X V1.5
Version 1.5 of the iQ-Analyzer-X is now available for download
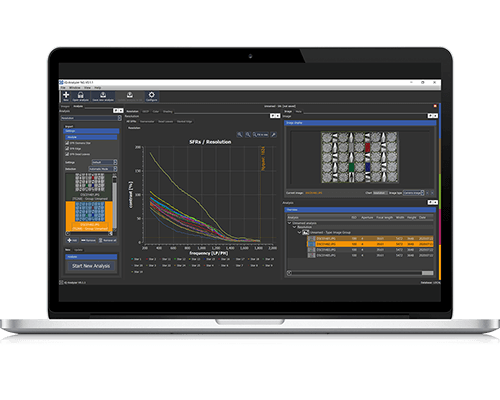
This version features a scripting interface with the command-line tool, batch script creation, and "Hot folder" functionality. In addition, the software now supports the lensTester and TE253 test charts. Other features include improvements to semi-automatic and manual ROI detection.
Python for iQ-LED API
Use the C interface with Python and other programming languages

The iQ-LED API is a comprehensive programming interface that enables you to create your own individual workflow while utilizing all the provided UI software's possibilities. We offer interfaces to the programming languages C++ and C. The C++ interface only depends on standard ISO C++, while the C interface can be used in various programming languages and SDKs, including Matlab, Labview, or Python. The iQ-LED API includes a complete Python UI program for controlling iQ-LED devices.
Join us at SPIE Photonics West
The event will be held January 25-27, 2022, in San Francisco
As part of the Nynomic joint booth, we will participate in the SPIE Photonics West conference this January. This will be our first face-to-face conference in the USA since 2019, and we are looking forward to sharing the latest advancements in camera and sensor performance testing. As mentioned, you will locate us at the Nynomic booth (#549), including six total companies from the Nynomic Group.
iQ-Knowledge - Chromatic Aberration
Understanding and identifying chromatic aberration
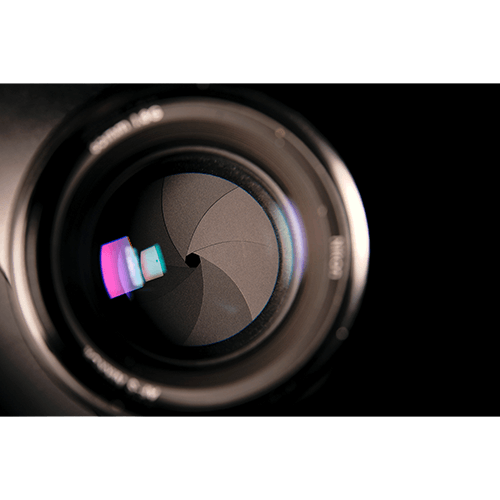
Lenses are designed so that refracted light meets at one focal point. Light, however, contains various wavelengths that refract differently. So light rays of different wavelengths (red, blue, and green, for example) may not meet at a common point. When this happens, color fringes appear along the borders of very light or dark parts of an image affecting the image quality.