Introduction
The iQ-Analyzer-X introduces the next generation of image quality evaluation. In this iteration of the software, we’ve built entirely on C++ and introduced new AI-powered tools to create an exceptionally modern and advanced camera analysis software for professionals looking to improve the image quality testing of their image capture systems.
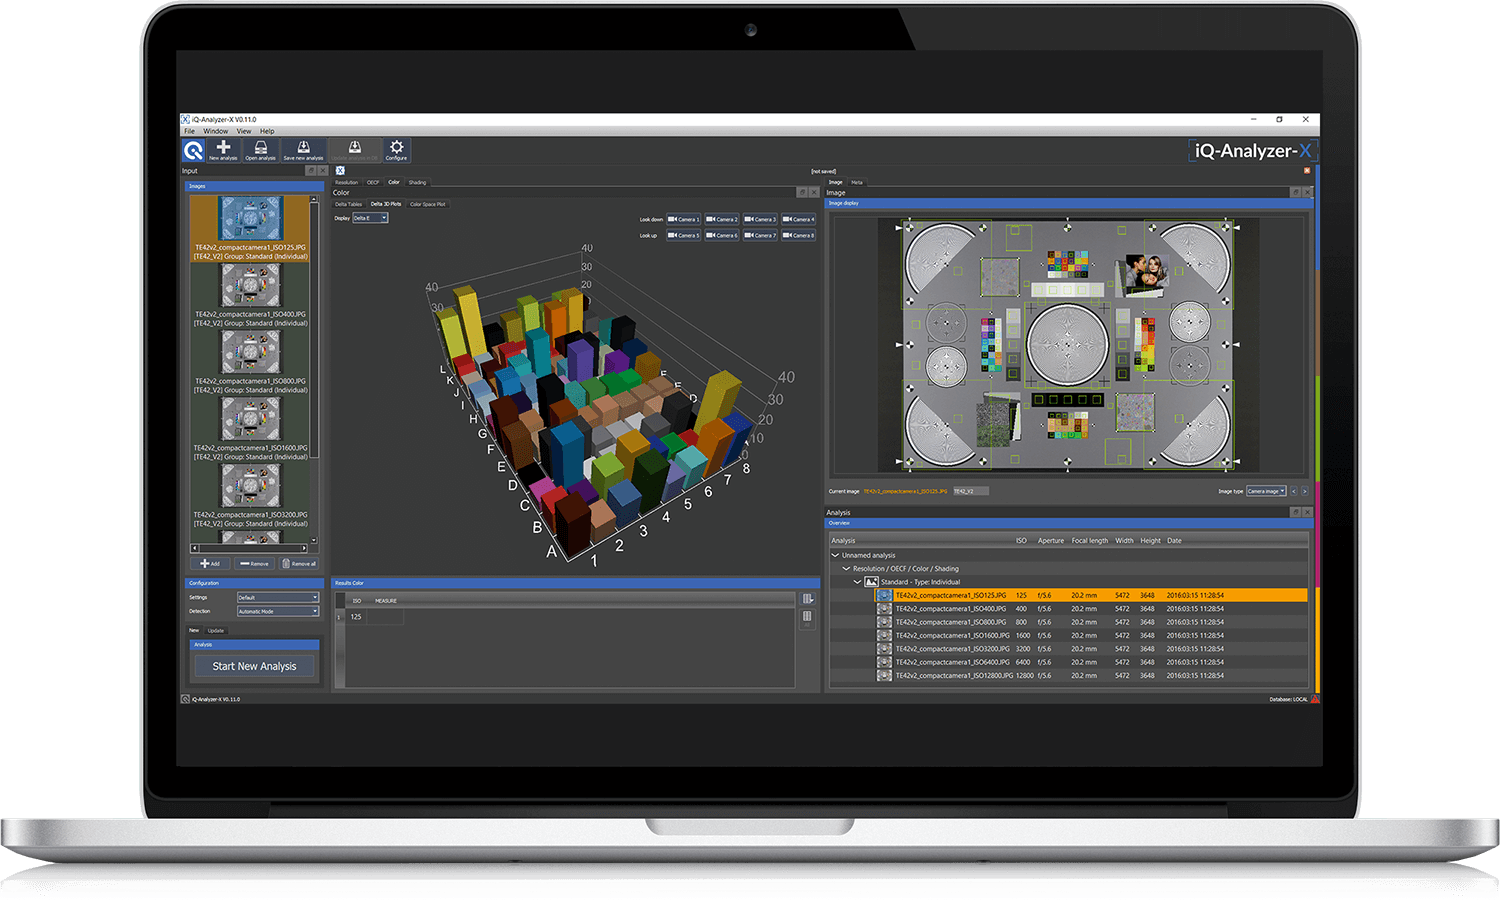
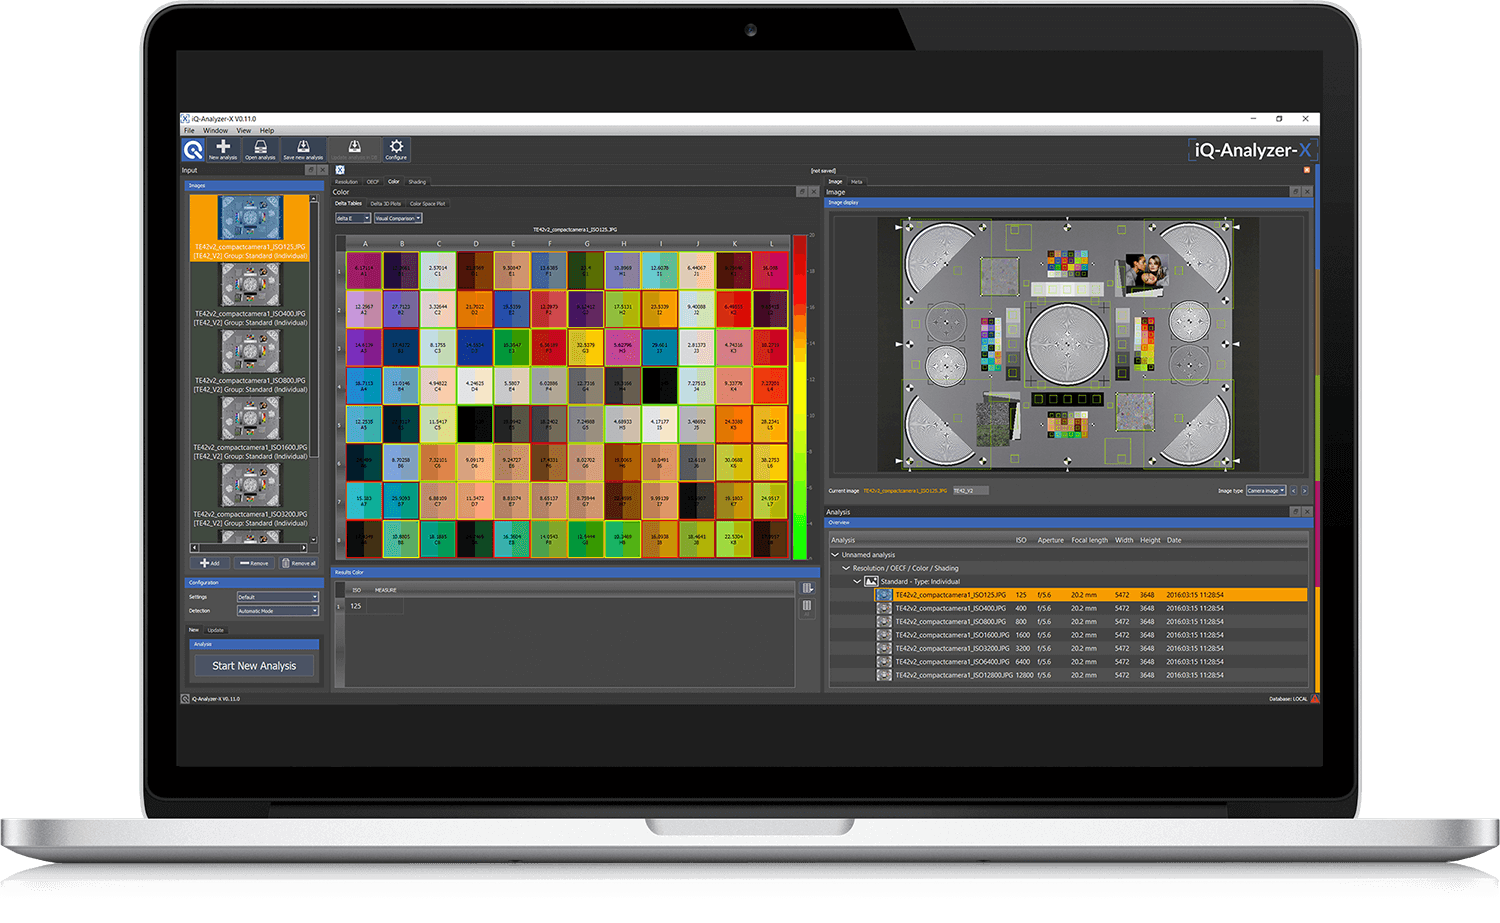
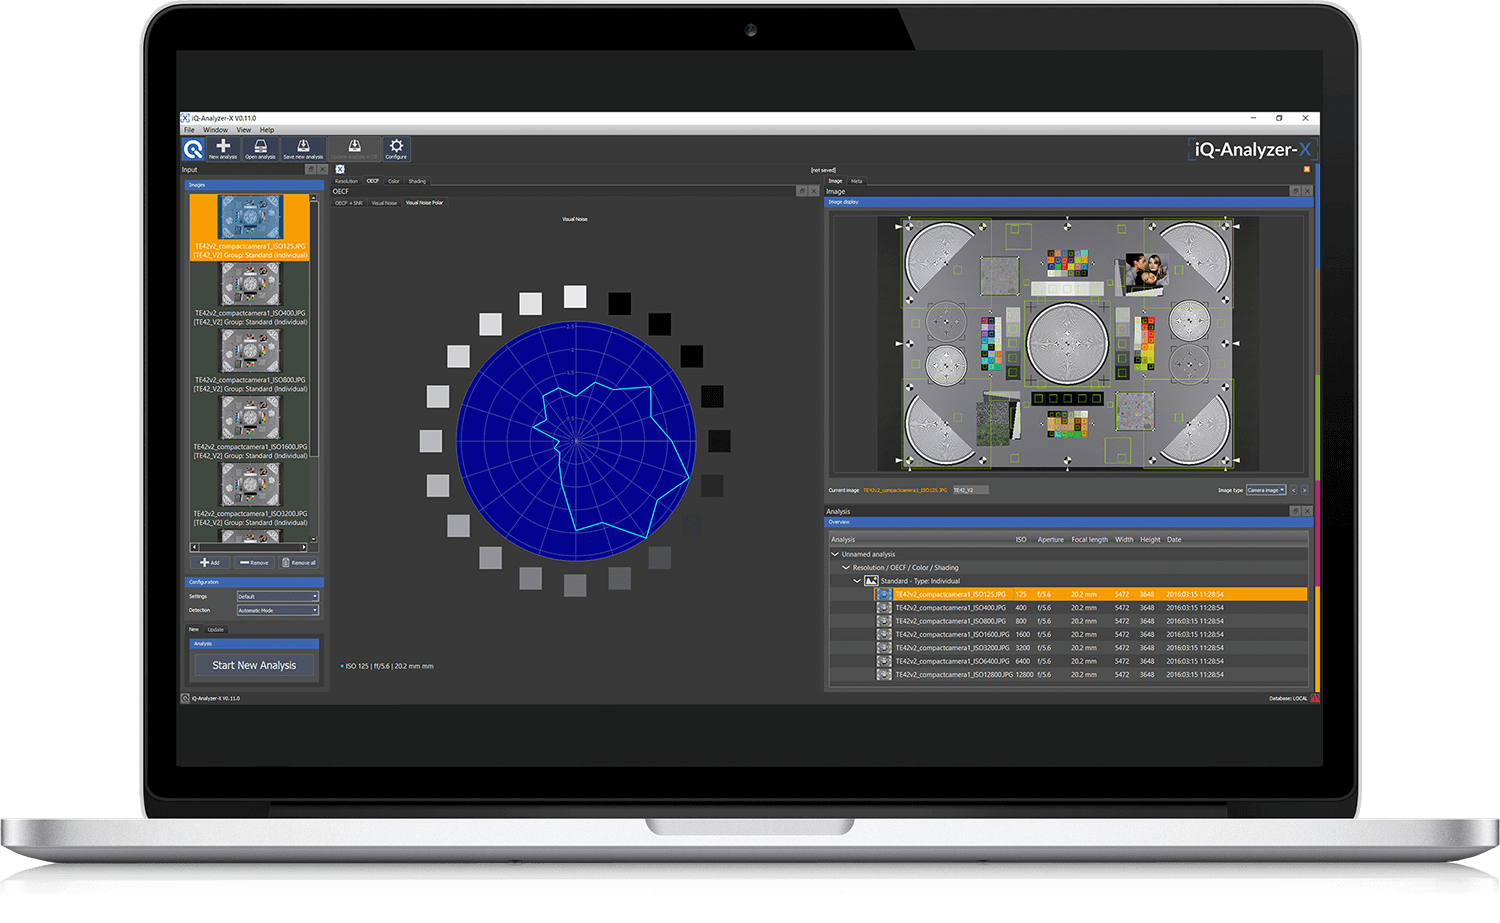
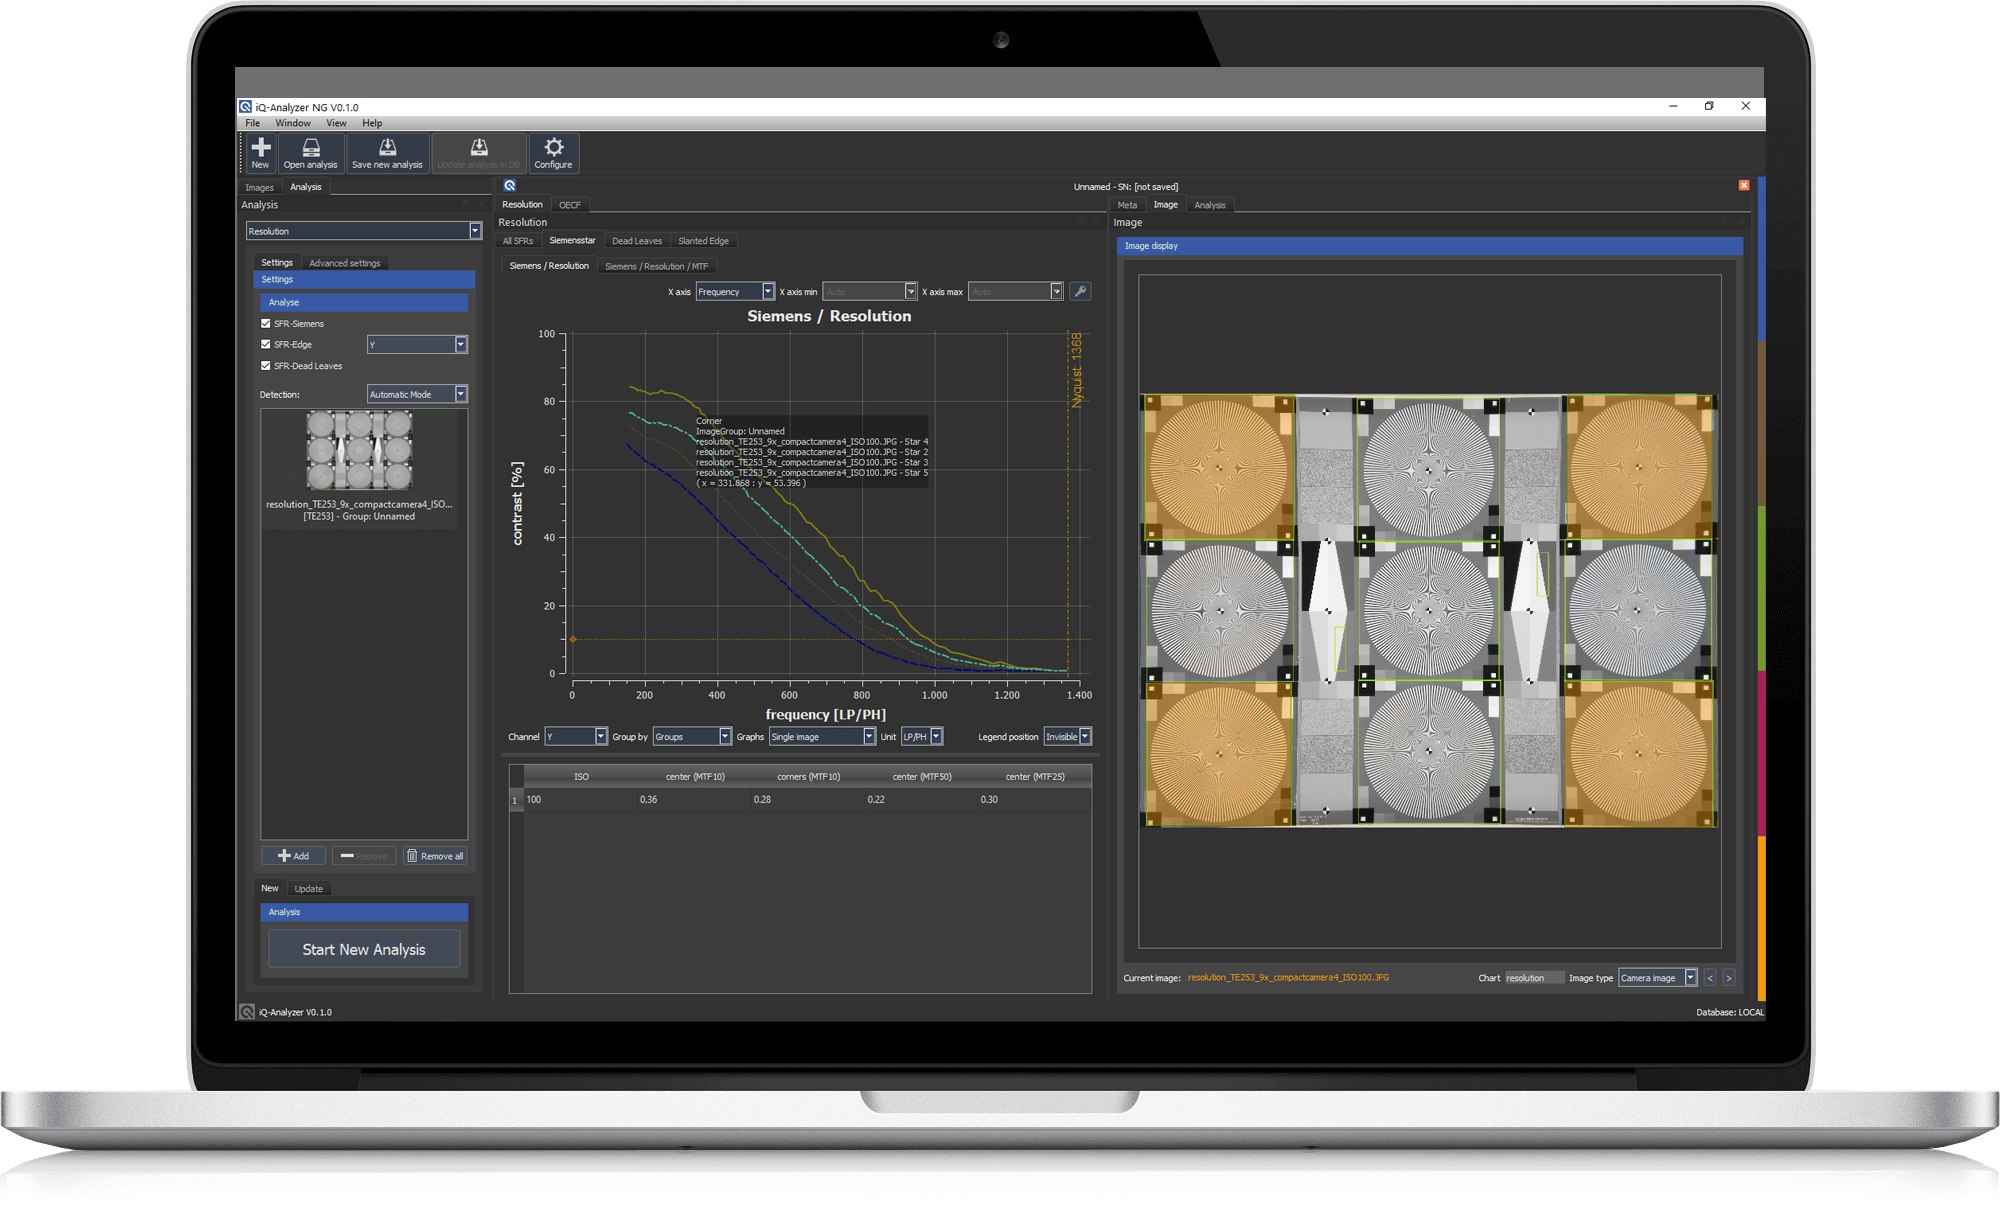
This software is ideal for camera and sensor developers during end-of-line testing who are looking to understand how their systems perform against a variety of image quality performance factors, including resolution (SFR), texture loss, dynamic range (OECF), color accuracy, lens distortion, shading, flare, low-light, and noise.
In previous versions, we relied on Mathworks Mathlab, which often limited our flexibility. Using C++ has increased workflow flexibility and allowed us to design an advanced, user-friendly interface. It also allows us to create script interfaces and access low-level APIs.
In addition to a more balanced and flexible user interface, we have introduced AI-powered test chart detection tools to enhance the speed and accuracy of image quality analysis. Captured results are quickly identified, and the target features and ROIs (regions of interest) are analyzed. Results and testing parameters can be stored in a local or server-based database for test result comparisons across labs and future evaluations.
The software can work with image and video files, including files from external webcams, integrated cameras, live streams, and capture servers. It also offers automation features such as hot folders and command-line interfaces to improve testing efficiency further.
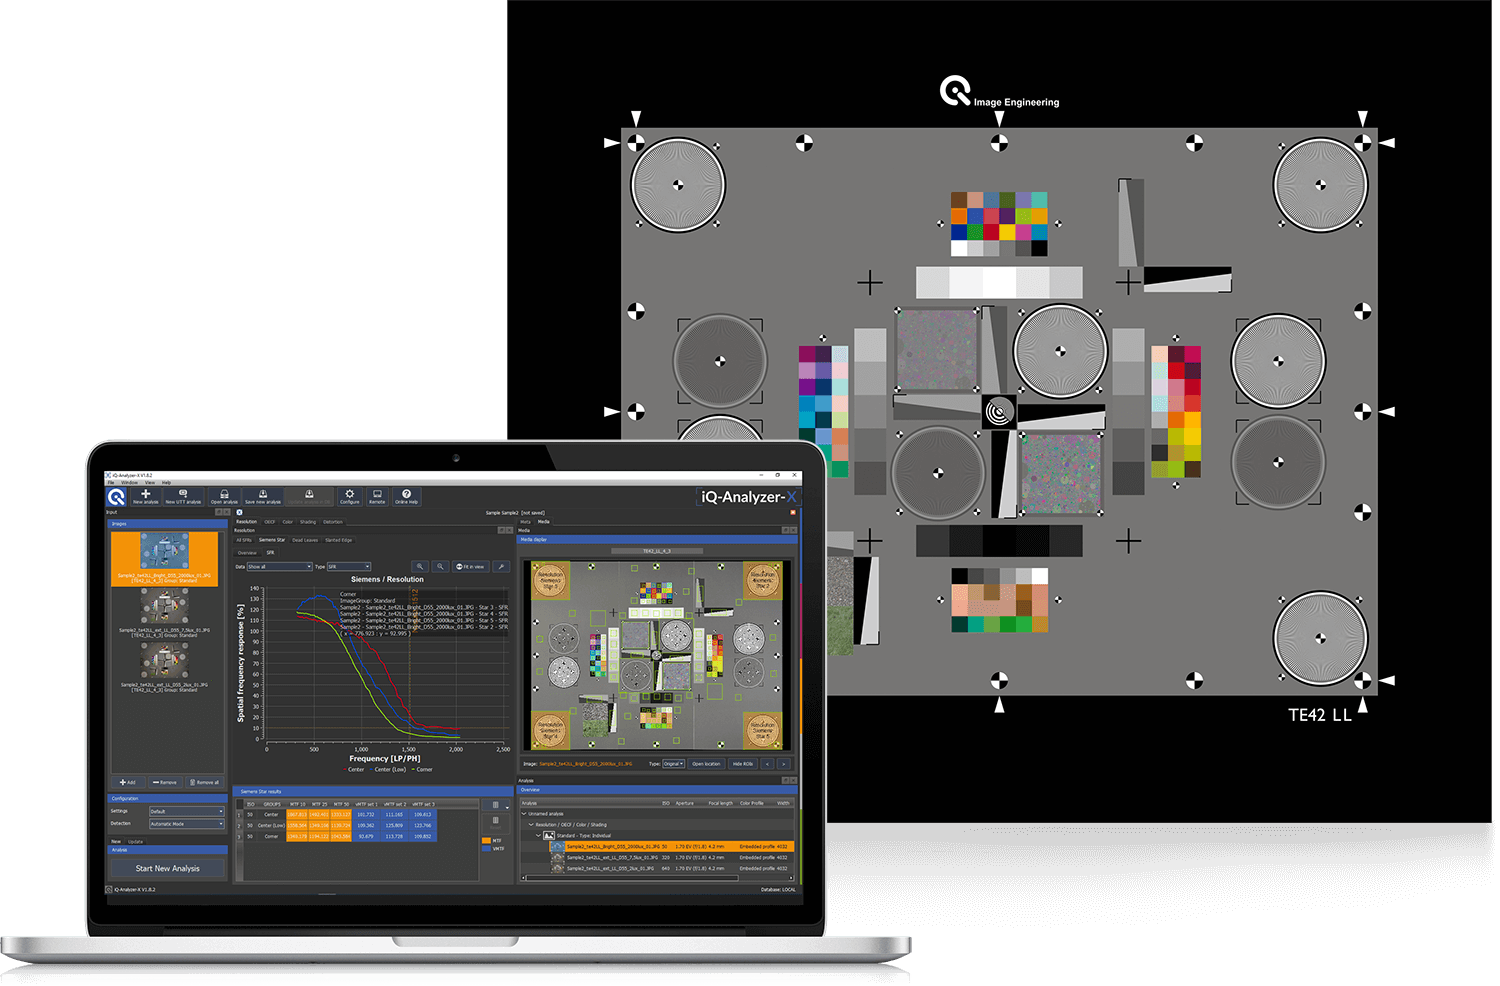
The iQ-Analyzer-X is compatible with numerous test charts, including our TE42 multipurpose series and custom-made charts. Using a TE42 multipurpose chart with the iQ-Analyzer-X creates a high-speed analysis solution, as you can analyze multiple image quality factors in a single test image.
Features
The iQ-Analyzer-X supports a large variety of test charts, including custom-made and multipurpose test charts.
The iQ-Analyzer-X can evaluate all of the important KPIs of a camera, including resolution, texture loss, color, dynamic range, etc.
The iQ-Analyzer-X offers many automated tools for improving workflow efficiency, including AI-powered chart detection, hot folders, and a command-line interface.
Analyze camera performance based on a variety of international standards, including ISO, IEEE, and VCX.
- Database storage
Save all results and image/video files to a local or server-based database. - AI-powered chart detection
Detect charts using machine learning and AI-based detection tools. - Custom test templates
Implement any custom requirements to create specific analysis templates.
- Analyze individual reference data
Optimize how you work with the individual reference data of your charts. - Analyze video files
Use the iQ-Analyzer-X to analyze video files from external webcams, integrated cameras, live streams, and capture servers. - Automation features
Use hot folders and command-line interfaces to improve workflow efficiency.
How it works
Check out the video for an in-depth look at the iQ-Analyzer-X. Our engineers will walk you through the user interface and show you many of the main features, including how to analyze video files and automation features such as creating hot folders and using command-line interfaces.
Versions
The iQ-Analyzer-X is available as a Pro, Cultural Heritage (CH) or Free version. The free version provides you with a fully functioning analysis software that will greatly improve the overall efficiency of your camera performance evaluations. To take advantage of all the features that the iQ-Analyzer-X offers, we recommend upgrading to the Pro version, available for purchase below.
- Compatible with all iQ-Analyzer-X test charts
- Install on unlimited devices
- Configurable user interface
- Analysis templates
- Analyze RAW files
- Configurable test result tables
- Zoom function of the image
-
Use individual reference data1 -
Save results to data base -
Export results as XML or PDF -
Maintenance Package and Priority Support2
- Compatible only with select charts3
- Install on unlimited devices
- Configurable user interface
- Configurable test result tables
- Zoom function of the image
- Use individual reference data1
- Save results to data base
- Export results as XML or PDF
- Maintenance Package and Priority Support2
- Compatible with all iQ-Analyzer-X test charts
- Install on unlimited devices
- Configurable user interface
- Analysis templates
- Analyze RAW files
- Configurable test result tables
- Zoom function of the image
- Use individual reference data1
- Save results to data base
- Export results as XML or PDF
- Maintenance Package and Priority Support2
2 The Pro version includes a one-year Maintenance Package that entitles you to all of the version upgrades as they become available. You also receive priority email/phone support and one free chart layout file.
3 Compatible charts include: UTT, TE258 (IT8), DT NGT2, IAM 9C, TE188, TE230.
Pro version details
When you purchase a Professional license, you will receive a USB dongle token for your license. You can install the iQ-Analyzer-X on an unlimited number of devices and then connect the USB Dongle to run the software. The network license feature allows you to connect the dongle to a host PC, and then the software can run on any device that has access to the host PC.
In addition, you will receive a one-year maintenance package. This package entitles you to all the version upgrades as they become available in your maintenance year. After your maintenance package concludes, you can continue using the iQ-Analyzer-X indefinitely; however, you cannot upgrade to future versions. If you wish to continue upgrading after one year, you can purchase additional maintenance years (multiple years can also be bought during the initial purchase) for a reduced price of €1,100.
Please contact our sales team for more details.
iQ-Analyzer-X CH
The Cultural Heritage (CH) version of the iQ-Analyzer-X is a special version for archiving professionals who document and preserve our past. It is based on the Pro version, but only the analysis of UTT and color charts or targets is possible using an adapted dongle. Combining these test charts and the software provides a powerful solution for evaluating the image quality of scanners and other devices to create digital replications of documents, photographs, and other reflective media.
The iQ-Analyzer-X CH is less expensive than the full standard version iQ-Analyzer-X PRO as it is limited to the requirements of the cultural heritage industry.
If you would like to try the CH version, download the free version and perform a UTT or color chart analysis with our sample images. Please note that your dongle will limit you to these charts once you purchase it.
Contact our sales team for more information.
Solectrix Partnership

iQ-Analyzer-X is now available in SXIVE 2.0 thanks to our recent partnership with Solectrix GmbH. SXIVE (Simplified eXtensive Image and Video Engine) is a comprehensive image prototyping solution for image processing and analysis requirements, including instant prototyping, development, and sensor and ISP evaluations. It also provides modular reference platforms, is test-drive-ready, and is suitable for acceptance tests.
In version 2.0, SXIVE implements the iQ-Analyzer-X for advanced image quality analysis of images and video for the first time. Together, SXIVE and iQ-Analyzer-X create a powerful solution that can be tailored to meet the requirements of any imaging project.
Read more about our partnership with Solectrix here.
iQ-Analyzer-X Newsletter
Always receive the latest software updates and development info with the
iQ-Analyzer-X newsletter.
Sign up now!
Get iQ-Analyzer-X Pro
iQ-Analyzer-X manual (pdf)
iQ-Analyzer-X manual (web)
iQ-Analyzer-X (pdf) 中文使用手册说明 (Chinese)
iQ-Analyzer-X manual (web) 日本語訳 (Japanese)