Introduction
Noise in an image is the presence of artifacts that do not originate from the original scene content. Generally speaking, noise is a statistical variation of a measurement created by a random process. In imaging, noise emerges as an artifact in the image that appears as a grainy structure covering the image.
Noise can have different forms and appearances within an image and is, in most cases, an unwanted or disturbing artifact that reduces the subjective image quality.
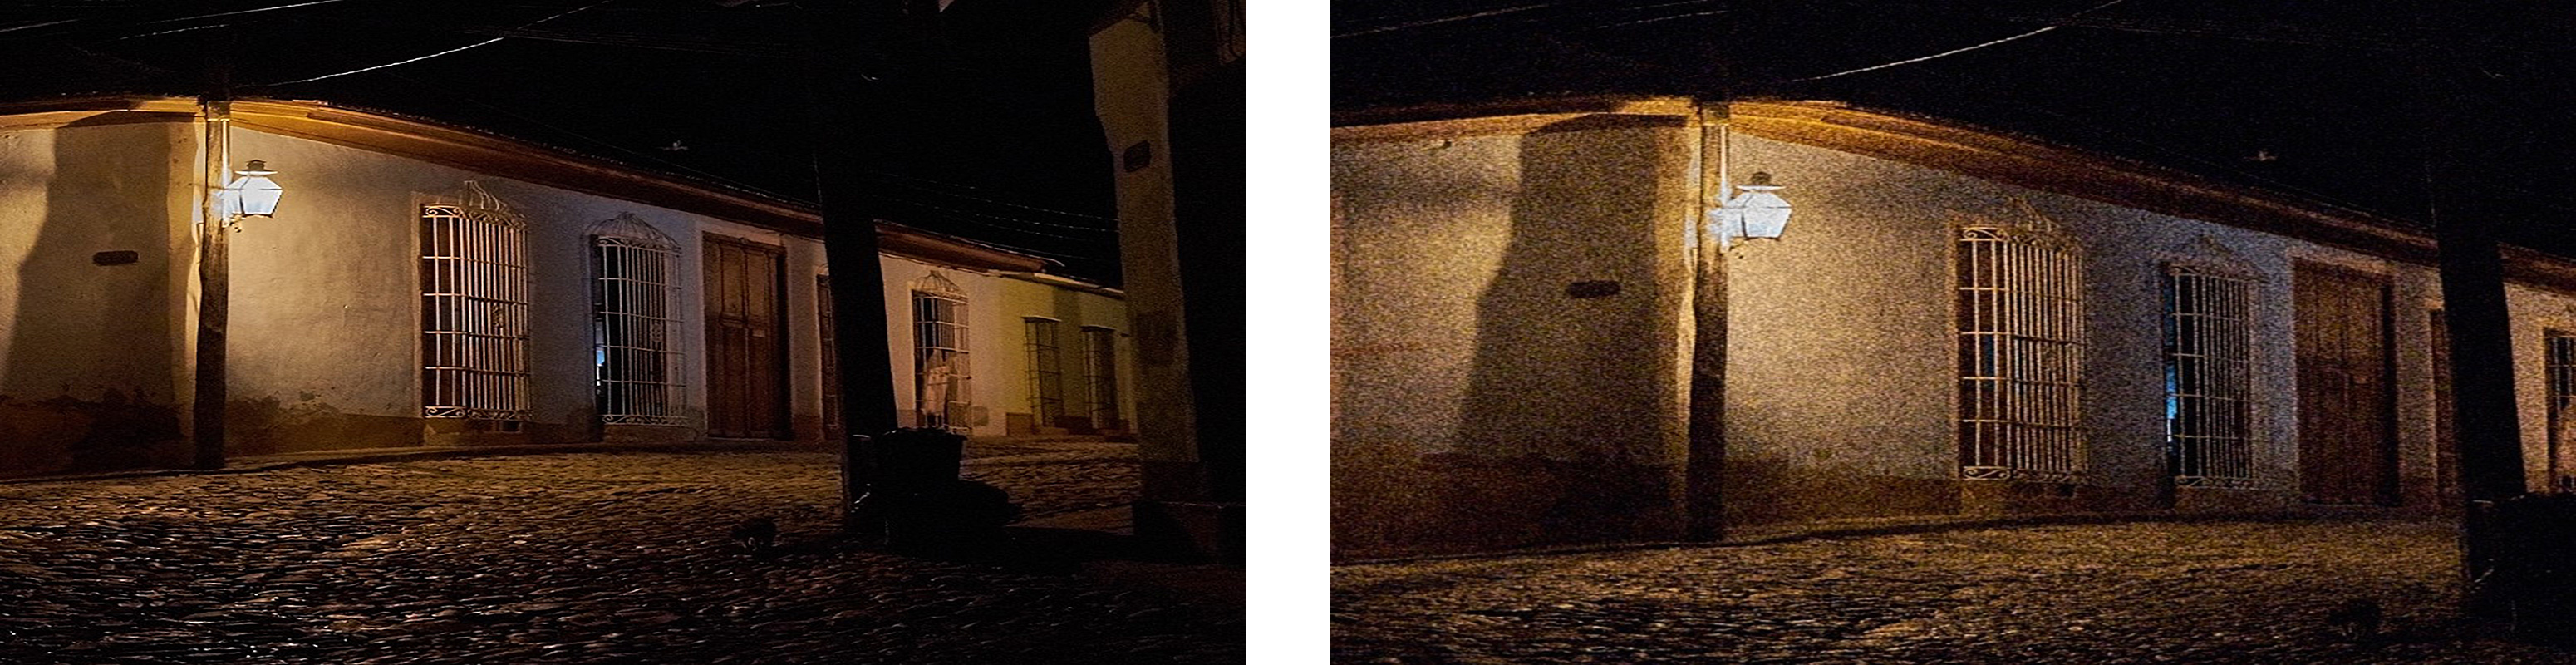
Image 1: An example of how noise can greatly affect the image quality.
The problem with noise
Noise is a byproduct of irregular signal fluctuations that accompany a transmitted signal. What’s important to understand here is that these fluctuations are not a part of the signal and instead obscure the intended target.
Thus, one of the most crucial tasks in imaging is finding a solution to create a strong signal with a minimum amount of noise beside it. Unfortunately, finding a solution often proves to be a significant challenge in imaging, particularly in a low-light situation where the signal is already low. When dealing with image noise, the first step is to identify the type of noise you’re encountering.
Noise types
In digital imaging, we encounter various types of noise. Unfortunately, the terms and definitions differ slightly across standards and publications, making it difficult to always agree on one or two solutions. In this article, we try our best to cover the most widely used definitions and solutions.
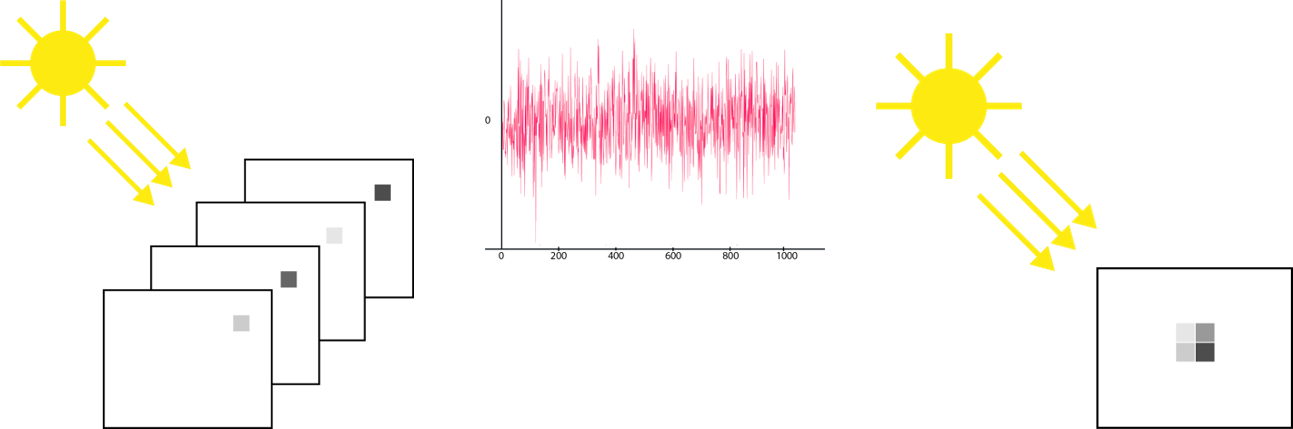
Image 2: Temporal noise (left) vs. spatial noise (right).
Temporal noise (random noise)
Temporal noise is almost always completely random and results from variations in generating a digital value from a single pixel by converting incoming photons into electrons. Also, the number of photons that hit a single-pixel during the exposure time will vary. This procedure is known as photon shot noise.
If we observe the same pixel in an image captured multiple times, we will see this pixel fluctuate between the various images, as demonstrated in image 2. Even though the images' scene doesn't change, we will still see a variation in the digital value we receive from this particular pixel.
Spatial noise (pattern noise or non-uniformity noise)
Variations in an individual pixel typically cause spatial noise and are therefore not random. This noise type is often referred to as "non-uniformities" because the term noise itself implies a random process. EMVA1288 uses the term "non-uniformity," while ISO 15739 uses "fixed pattern noise."
Pixels positioned next to each other on the sensor will display differences in their digital values even if the object is equal. As a result, each pixel will show a slightly different behavior resulting in slightly contrasting digital values.
Keep in mind that variations between the pixel can also be caused by temporal noise. The various forms of spatial noise are only observable when minimizing the temporal noise. This process is typically carried out by averaging hundreds of images to minimize the random component. The remaining (averaged) image will show then only show the spatial noise.
One form of spatial noise is Pixel Response Non-Uniformity (PRNU), a slight variation in each pixel's sensitivity. Dark Signal Non-Uniformity (DSNU) is another form that has a slight variance between pixels in their signal, or, more simply put, the generated signal in the absence of light.
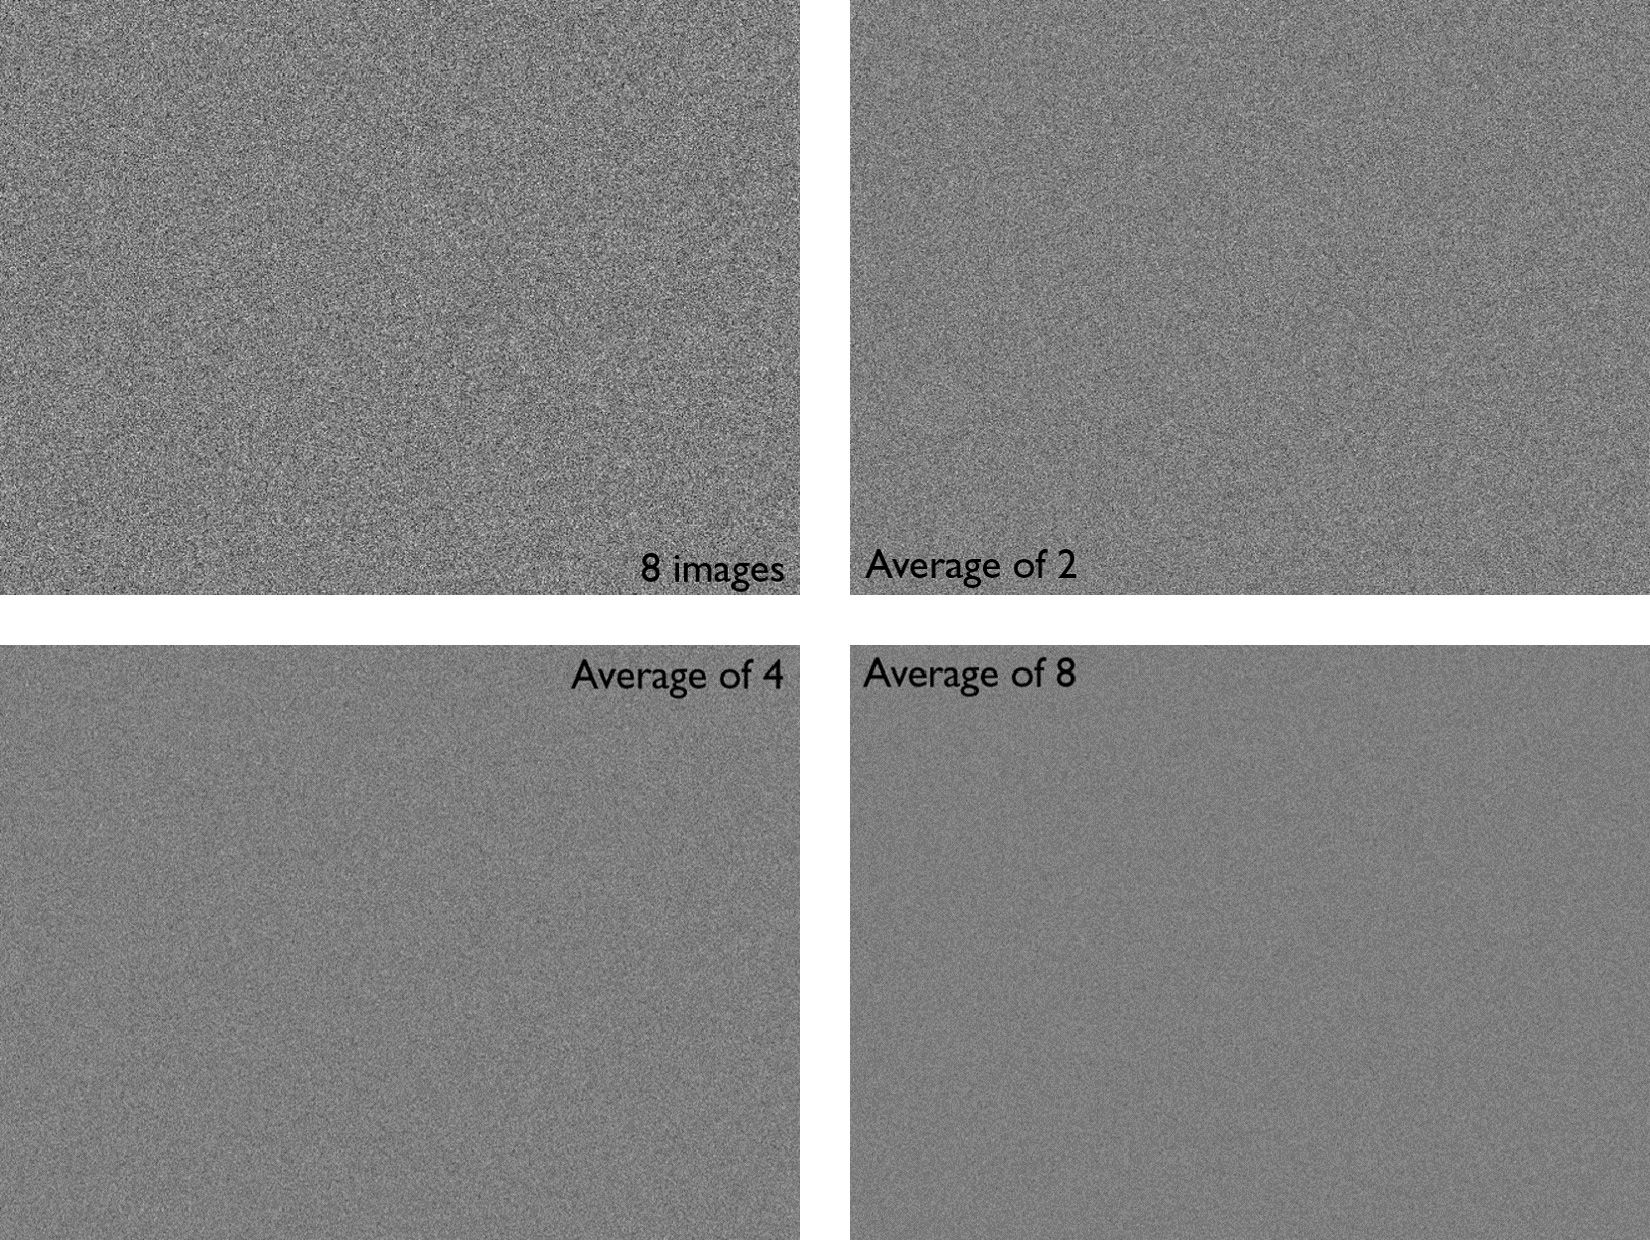
Image 3: Averaging images together to reduce the presence of noise.
Color noise vs. Intensity noise
In the previous section, we only analyzed single pixels' behavior and their neighbors from Monochrome sensors. These sensors will only show the noise as a variation in the intensity. Color sensors, however, will display both intensity noise and color noise.
Color noise is created and amplified during the generation of color information. Essentially, a single-pixel captures only color information for a specific band of the light spectrum (e.g., Red, Green, or Blue). This process is valid for nearly all types of sensors.
Color noise is attributed to a process known as demosaicing. Essentially, the missing color information is interpolated from a neighboring pixel to ensure Red, Green, and Blue are obtained in each pixel. As a result, the noise of an individual pixel will affect the color information of a neighboring pixel. During the interpolation process, the noise in these pixels will smear out.
The typical color noise scenario in imaging is strong noise in the blue channel and lower noise in the green and red channels. The intense noise in the blue channel will also affect the other channels due to demosaicing.
It's important to note that the human observer is much more sensitive to intensity noise than color noise. Nevertheless, intense color noise can still be disturbing to the overall image quality.
Noise sources
There are many different sources of noise in an image. To simplify, we can differentiate into two primary noise sources: Photon-Shot noise and Read noise.
Photon-shot noise
The photon-shot noise refers to the noise of the light itself. If we imagine light as a flow of photons, then we see that this flow is not perfectly constant over time. To compare, picture an instrument that measures rain on a small surface. If we have heavy rain, we can accurately provide a number that is the average for the surface per time interval. However, very light rain will only show a few drops per time interval and change rapidly for the various measurements.
The same idea from the rain example applies to photon-shot noise. The ratio of signal to noise (SNR) equals the signal's square root for photon-shot noise. Put simply, the more photons we have, the better the SNR and vice versa.

Image 4: The more signal we have the better the SNR.1
Read noise
Read noise is a summary of multiple types of noise sources within the reading process of the sensor. In many cases, the noise is constant, so the lower the signal, the worse the SNR. Likewise, the lower the number of photons, the lower the SNR.
When we plot the SNR vs. the number of photons per pixel per exposure, we can differentiate the SNR into two regions:
Read-noise limited: Occurs when the read noise is so intense that the SNR is significantly lower than the lowest SNR that appears from the photon shot noise.
Photon shot noise limited: Occurs when the measured SNR is just slightly below the highest SNR that you can reach with the photon shot noise.
Improving noise
A perfect camera (free of read noise and quantization noise) is not noise-free but will still show the photon shot noise. However, keep in mind that the lower the number of photons per pixel per exposure, the worse the SNR.
To improve noise on the sensor level, you need to reduce the read noise and increase the number of photons per pixel per exposure. Larger pixels will collect more photons, and a longer exposure time will capture more photons. The maximum length of the exposure time is based on the application as it will also introduce motion blur. Options for improving noise are thus limited, but, in many cases, signal processing will reduce the noise from the signal using image enhancement and noise reduction algorithms.
How to measure noise?
ISO 15739 SNR
ISO standard 15739 describes a procedure to measure and report the SNR of a camera.2 The method uses a test target based on ISO 14524, so the camera under test can reproduce a test target under controlled conditions.3 See example targets below:
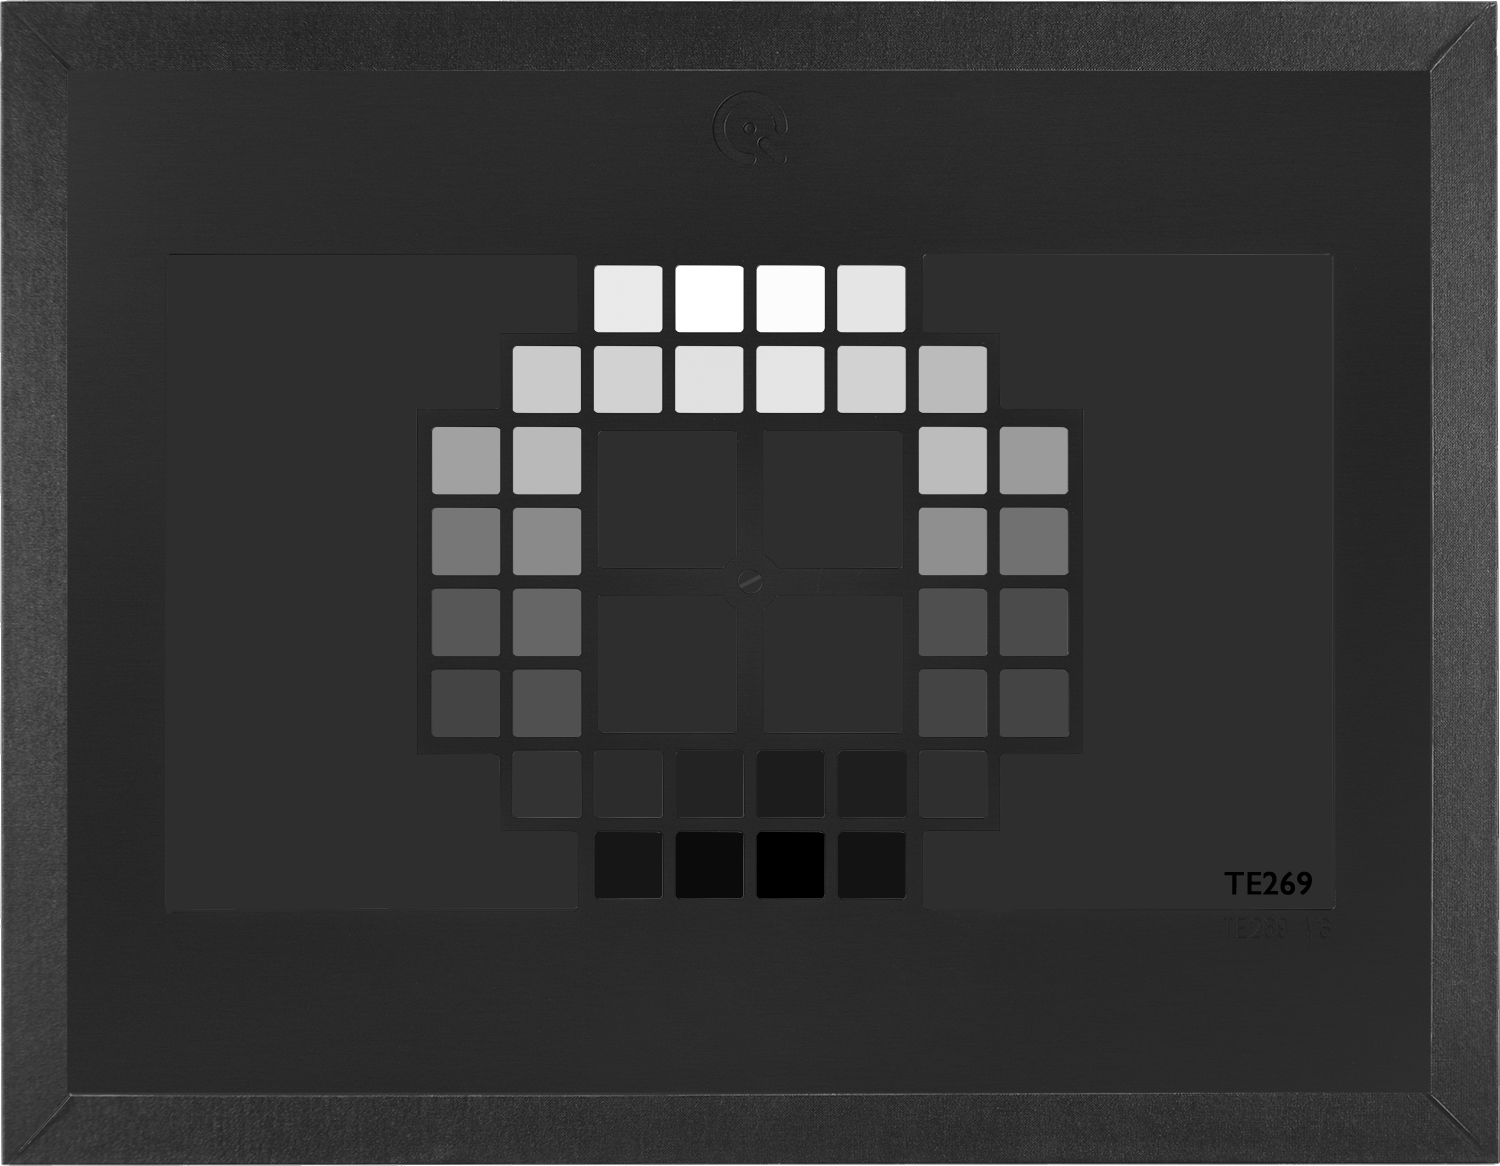
Image 5: The TE269 OECF test chart for measuring noise.
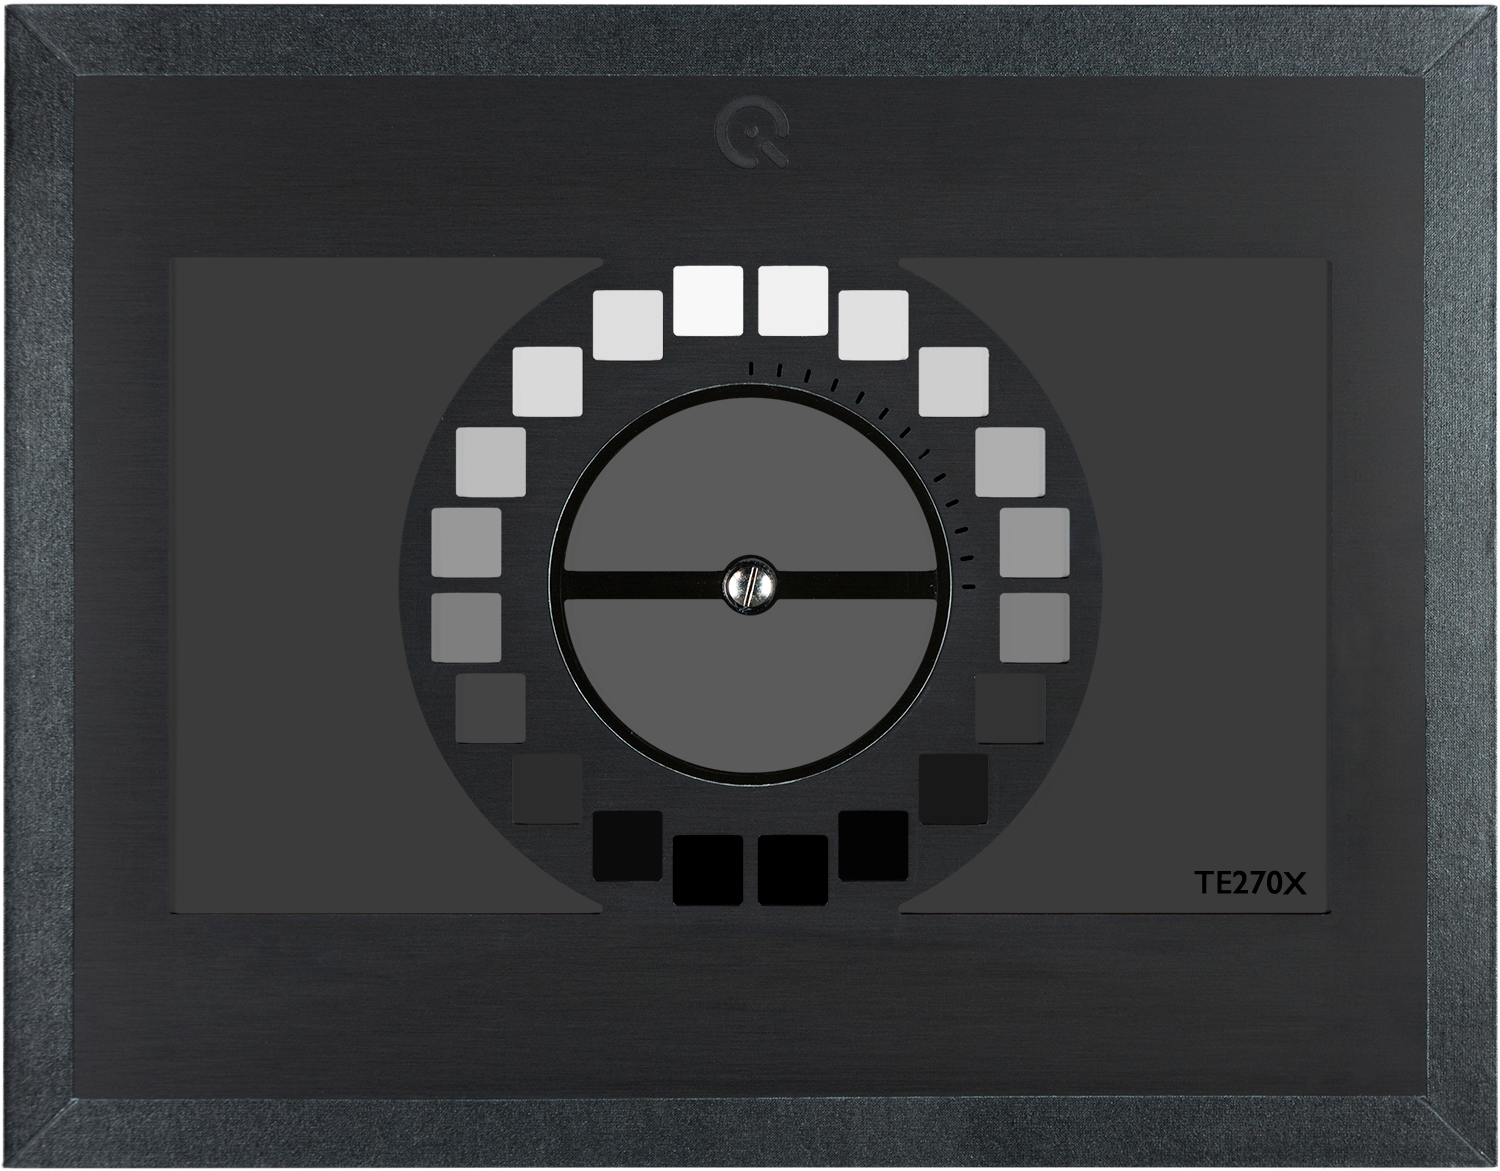
Image 6: The TE270X test chart for measuring noise.
The SNR is calculated for every patch of the test target and provides a function of SNR vs. Luminance. To report a single number, follow the numbered approach.
Extract L_ref from the OECF
Calculate L_SNR
Interpolate and report the SNR for L_SNR
The reference luminance (L_ref) is the lowest luminance that leads to a digital value of 245 in one of the three channels. The value of 245 is valid for 8bit sRGB images.
If we have the L_ref, then we can easily calculate the L_SNR as:
LSNR = 0,13 x Lref
Where does the 0.13 or 13% originate? The idea is to calculate on an 18% gray card, but the exposure control of a camera would not expose an 18% reflection to 18% of the maximum digital value as it requires some “headroom” for highlights in the image. The ISO assumes a headroom of 140%, thus resulting in the 13%.
Essentially, when the L_SNR is known, the corresponding SNR value is interpolated from the SNR curve.
Measuring noise using the dead leaves pattern
Another option for measuring noise is using the dead leaves pattern4. This pattern consists of a random pattern of circles with varying diameter and color, giving us a non-uniform pattern. Measuring noise using a non-uniform pattern will provide better results of the actual noise performance and ultimately lead to a better user experience correlation.
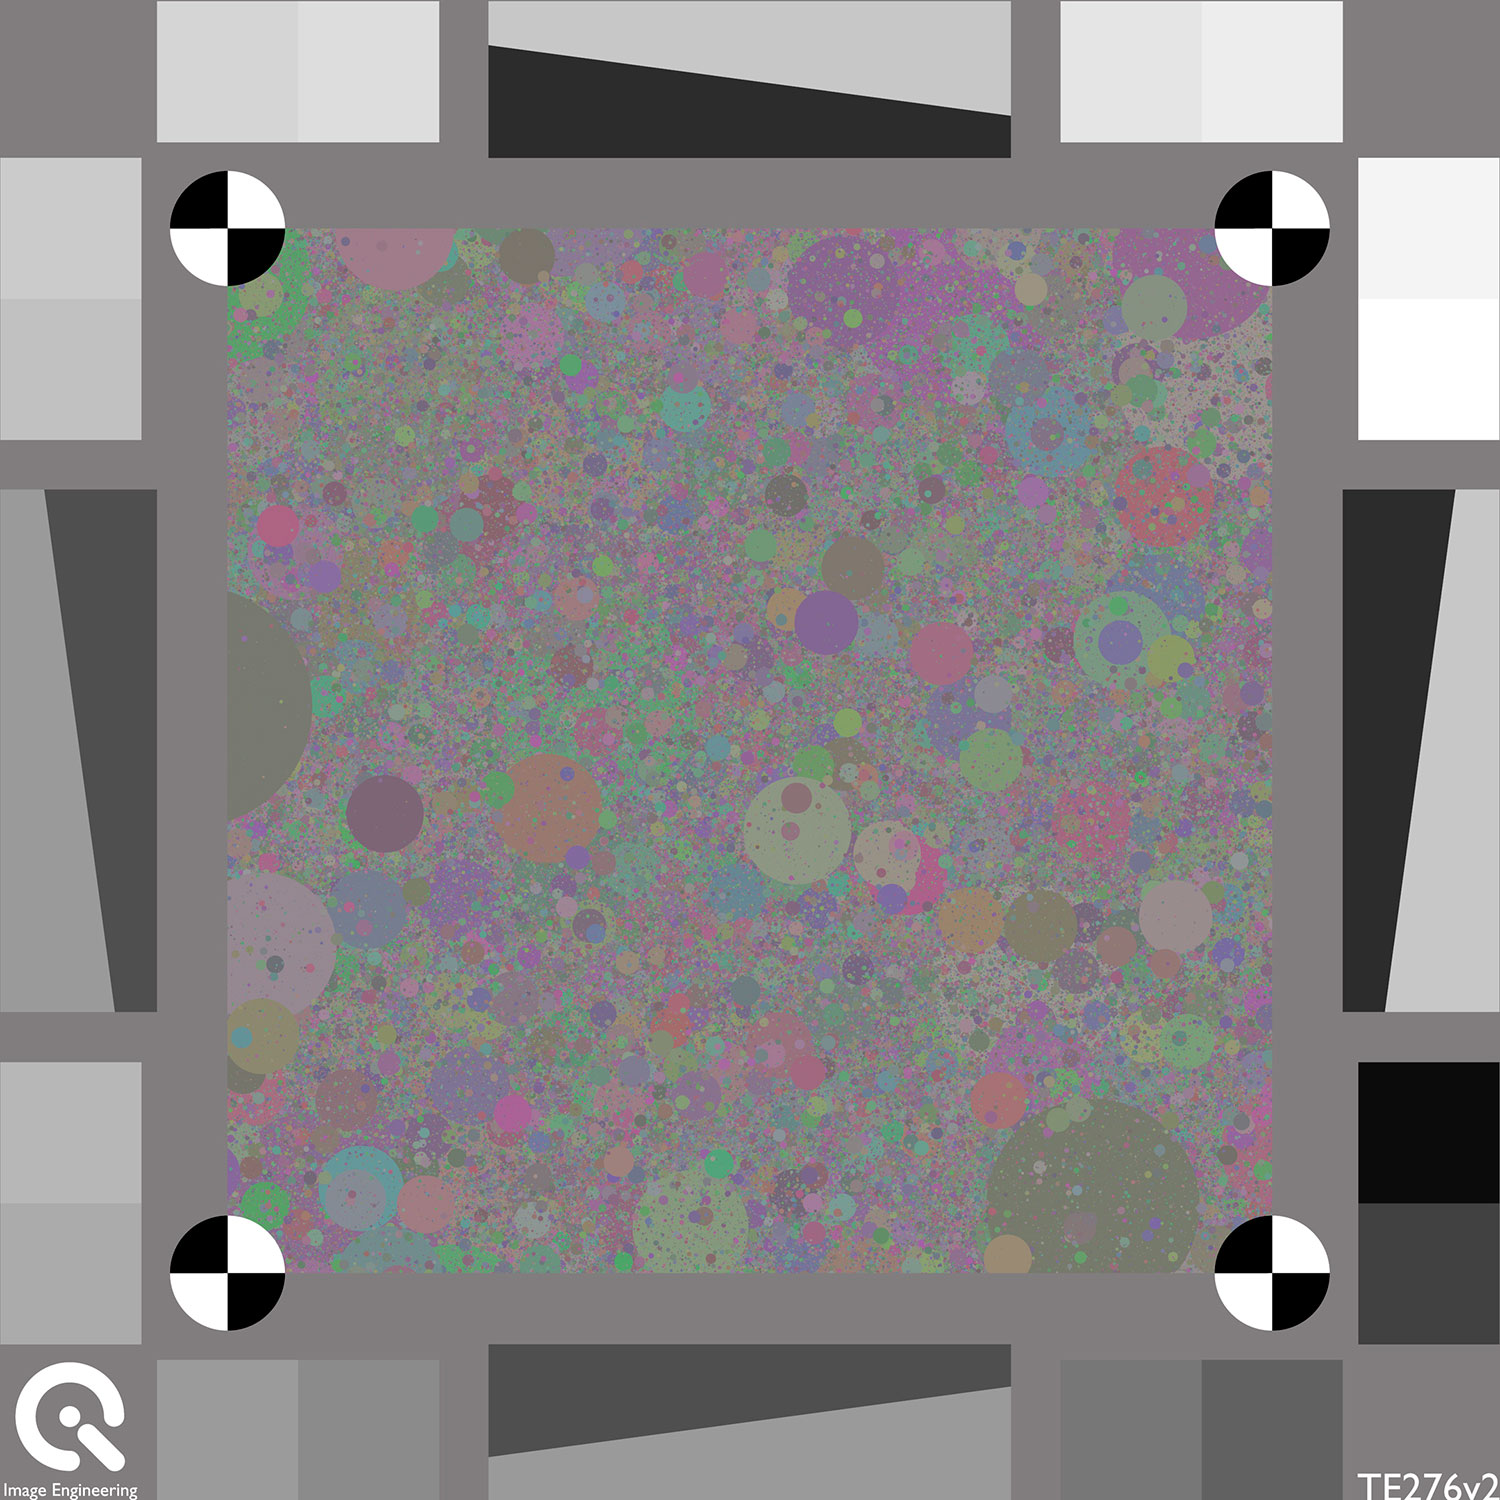
Image 7: An example of the dead leaves test pattern.
Noise standards (that we use)
ISO 15739 Visual noise
While the SNR value is a well-established metric for describing a sensor's performance, it's not the best choice when wanting to express how much noise a human observer can see.
ISO 15739 uses a metric called visual noise, which correlates much better with the human perception of noise than the SNR.
The Visual Noise value is simple to understand: The higher the value, the more noise an observer will see. The major difference between the SNR and VN is that VN will weigh the noise according to the visibility. The noise that cannot be seen will not be taken into account for the noise measurement.
How do we know what noise a human observer can/cannot see?
We can model the response of the human visual system to spatial frequencies. Essentially, the Contrast Sensitivity Function (CSF) and an assumption of the viewing condition allow us to calculate the importance of different noise spectrum parts. In the image below, Image 1x will have most of its "noise" in the high spatial frequencies and a low response in the CSF. Image 4x has most of its "noise" in the lower spatial frequencies and can be easily observed according to the CSF. Thus, Image 4x gets a much higher VN value than 1x.

Image 8: 1x, 2x, and 4x noise. The 4x noise has a much higher visual noise value than the others.
EMVA 1288 Non-Uniformities
The EMVA (European Machine Vision Association) 1288 was established to help the buyer choose the best camera or sensor that fits their requirements.5 The standard describes a proper test setup, test procedure, algorithms, and reporting for thoroughly testing the noise in a camera system.
A test using these guidelines will yield noise values for the following: Dark Signal Non-Uniformity (DSNU), Signal to Noise Raito (SNR), Pixel Response Non-Uniformity (PRNU), dark noise, and dark current.
Conclusion
Noise is a byproduct of irregular signal fluctuations that accompany a transmitted signal, but these fluctuations are not a part of the signal and instead obscure the intended target. As a result, one of the most crucial tasks in imaging is finding a solution to create a strong signal with a minimum amount of noise beside it.
We have outlined a few different solutions for measuring the impact of noise. In our test lab, we follow ISO 15739 to obtain the SNR as it is a much more accurate representation of the human perception of noise in an image. We also often utilize the dead leaves chart to correlate our testing with that of a natural environment.
It is most important to find a solution that covers the specifications of your devices under test.